Medicine - Vaccination > 1904-1928 - Report on vaccination in the North-West Frontier Province > Notes on vaccination in the North-West Frontier Province 1923-1928 > 1922-1923 - Notes on vaccination in the North-West Frontier Province for the year 1922-23
(25) Page ii
Download files
Individual page:
Thumbnail gallery: Grid view | List view

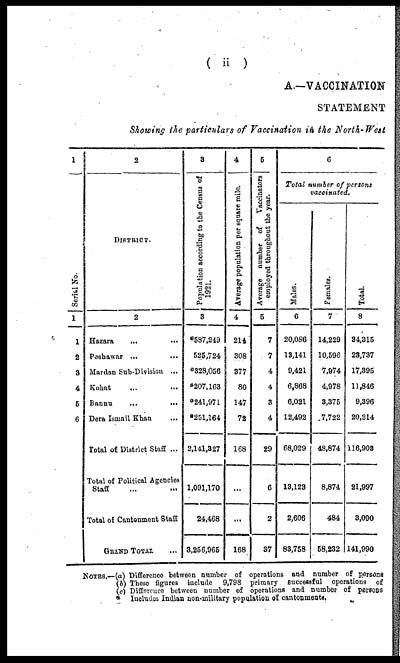
( ii )
A.—VACCINATION
STATEMENT
Showing the particulars of Vaccination in the North-West
|
1 |
2 |
3 |
4 |
5 |
6 |
||
|
Serial No. |
DISTRICT. |
Population according to the Census of |
Average population per square mile. |
Average number of Vaccinators |
Total number of persons |
||
|
Males. |
Females. |
Total. |
|||||
|
1 |
2 |
3 |
4 |
5 |
6 |
7 |
8 |
|
1 |
Hazara ... ... |
*587,249 |
214 |
7 |
20,086 |
14,229 |
34,315 |
|
2 |
Peshawar ... ... |
525,724 |
308 |
7 |
13,141 |
10,596 |
23,737 |
|
3 |
Mardan Sub-Division ... |
*328,056 |
377 |
4 |
9,421 |
7,974 |
17,395 |
|
4 |
Kohat ... ... |
*207,163 |
80 |
4 |
6,868 |
4,978 |
11,846 |
|
5 |
Bannu ... ... |
*241,971 |
147 |
3 |
6,021 |
3,375 |
9,396 |
|
6 |
Dera Ismail Khan ... |
*251,164 |
72 |
4 |
12,492 |
7,722 |
20,214 |
|
Total of District Staff ... |
2,141,327 |
168 |
29 |
68,029 |
48,874 |
116,903 |
|
|
Total of Political Agencies |
1,091,170 |
... |
6 |
13,123 |
8,874 |
21,997 |
|
|
Total of Cantonment Staff |
24,468 |
... |
2 |
2,606 |
484 |
3,090 |
|
|
GRAND TOTAL ... |
3,256,965 |
168 |
37 |
83,758 |
58,232 |
141,990 |
|
NOTES.—(a) Difference between number of operations and number of persons
(b) These figures include 9,798 primary successful operations of
(c) Difference between number of operations and number of persons
* Includes Indian non-military population of cantonments.
Set display mode to: Large image | Zoom image | Transcription
Images and transcriptions on this page, including medium image downloads, may be used under the Creative Commons Attribution 4.0 International Licence unless otherwise stated. ![]()
| Permanent URL | https://digital.nls.uk/90720357 |
|---|
| Attribution and copyright: |
|
|---|


