Medicine - Vaccination > 1902-1928 - Report on vaccination in the United Provinces > Vaccination United Provinces of Agra and Oudh 1923-1928 > Notes on vaccination in the United Provinces of Agra and Oudh for the year ending March 31, 1927
(252) Page v
Download files
Individual page:
Thumbnail gallery: Grid view | List view

( v )
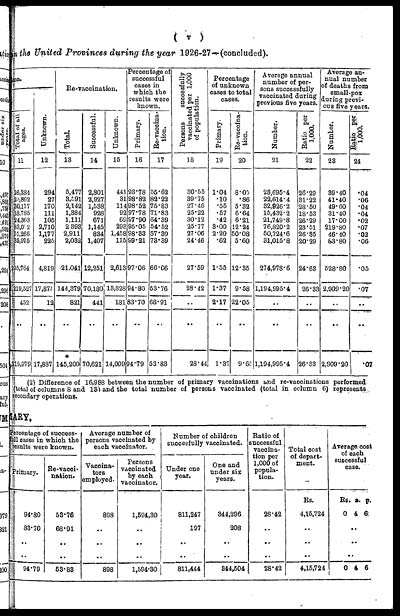
in the United Provinces during the year 1926-27—(concluded).
|
on. |
Re-vaccination. |
Percentage of |
Persons succesfully |
Percentage |
Average annual |
Average an- |
|||||||
|
Total of all |
Unknown. |
||||||||||||
|
Total. |
Successful. |
Unknown. |
Primary. |
Re-vaccina- |
Primary. |
Re-vaccina- |
Number. |
Ratio per |
Number. |
Ratio per |
|||
|
11 |
12 |
13 |
14 |
15 |
16 |
17 |
18 |
19 |
20 |
21 |
22 |
23 |
24 |
|
26,284 |
294 |
5,477 |
2,801 |
441 |
93.78 |
55.62 |
30.55 |
1.04 |
8.05 |
23,695.4 |
26.29 |
39.40 |
.04 |
|
25,862 |
27 |
3,591 |
2,927 |
31 |
98.82 |
82.22 |
39.75 |
.10 |
.86 |
22,614.4 |
31.22 |
41.40 |
.06 |
|
30,177 |
170 |
2,142 |
1,538 |
114 |
98.52 |
75.83 |
27.46 |
.55 |
5.32 |
32,926.2 |
28.50 |
49.60 |
.04 |
|
18,785 |
111 |
1,384 |
928 |
92 |
97.78 |
71.83 |
25.22 |
.57 |
6.64 |
15,432.2 |
18.53 |
31.40 |
.04 |
|
24,363 |
105 |
1,111 |
671 |
69 |
S7.90 |
64.39 |
30.12 |
.42 |
6.21 |
21,749.8 |
26.29 |
17.00 |
.02 |
|
83,052 |
2,710 |
2 398 |
1,145 |
293 |
95.05 |
54.52 |
25.77 |
3.00 |
12.24 |
76,820.2 |
23.51 |
219.80 |
.07 |
|
51,266 |
1,177 |
2,911 |
834 |
1,458 |
98.33 |
57.39 |
27.06 |
2.20 |
50.08 |
50,724.6 |
26.35 |
46.40 |
.02 |
|
35,975 |
225 |
2,032 |
1,407 |
115 |
99.21 |
73.39 |
24.46 |
.62 |
5.60 |
31,015.8 |
20.29 |
83.80 |
.06 |
|
295,764 |
4,819 |
21,041 |
12,251 |
2,613 |
97.06 |
66.06 |
27.59 |
1.55 |
12.35 |
274,978.6 |
24.63 |
528.80 |
.05 |
|
219,527 |
17,875 |
144,379 |
70,180 |
13,828 |
94.80 |
53.76 |
28.42 |
1.37 |
9.58 |
1,194,995.4 |
26.33 |
2,909.20 |
.07 |
|
452 |
12 |
821 |
441 |
181 |
83.70 |
68.91 |
.. |
2.17 |
22.05 |
.. |
.. |
.. |
.. |
|
.. |
.. |
.. |
.. |
.. |
.. |
.. |
.. |
.. |
.. |
.. |
.. |
.. |
.. |
|
19,979 |
17,887 |
* |
70,621 |
14,009 |
94.79 |
53.83 |
28.44 |
1.37 |
9.65 |
1,194,995.4 |
26.33 |
2,909.20 |
.07 |
(2) Difference of 16,988 between the number of primary vaccinations and re-vaccinations performed
(total of columns 8 and 13) and the total number of persons vaccinated (total in column 6) represents
secondary operations.
ARY.
|
Prcentage of success. |
Average number of |
Number of children |
Ratio of |
Total cost |
Average cost |
|||||
|
Primary. |
Re-vacci- |
Vaccina- |
Persons |
Under one |
One and |
|||||
|
Rs. |
Rs. |
a. |
p. |
|||||||
|
94.80 |
53.76 |
898 |
1,594,30 |
811,247 |
344,296 |
28.42 |
4,15,724 |
0 |
4 |
6 |
|
83.70 |
68.91 |
.. |
.. |
197 |
208 |
. . |
.. |
.. |
||
|
.. |
.. |
.. |
.. |
.. |
.. |
.. |
.. |
.. |
||
|
.. |
.. |
.. |
.. |
.. |
.. |
.. |
.. |
.. |
||
|
94.79 |
53.83 |
898 |
1,594.30 |
811,444 |
344,504 |
28.42 |
4,15,724 |
0 |
4 |
6 |
Set display mode to: Large image | Zoom image | Transcription
Images and transcriptions on this page, including medium image downloads, may be used under the Creative Commons Attribution 4.0 International Licence unless otherwise stated. ![]()
| Permanent URL | https://digital.nls.uk/90513560 |
|---|
| Attribution and copyright: |
|
|---|


