Medicine - Vaccination > 1902-1928 - Report on vaccination in the United Provinces > Vaccination United Provinces of Agra and Oudh 1923-1928 > Notes on vaccination in the United Provinces of Agra and Oudh for the year ending March 31, 1927
(232) Page 2
Download files
Individual page:
Thumbnail gallery: Grid view | List view

( 2 )
Average cost of each
successful case of vac-
cination.
(Statement II.)
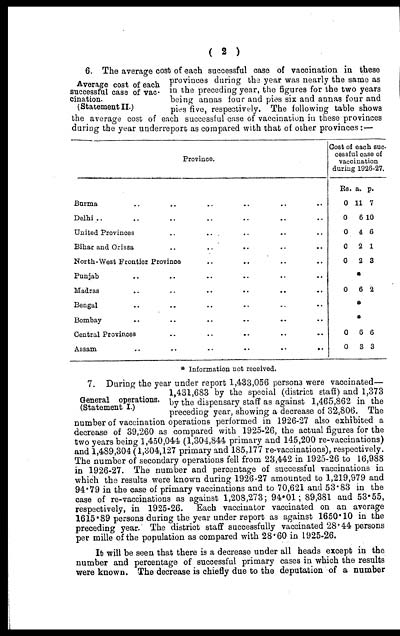
6. The average cost of each successful case of vaccination in these
provinces during the year was nearly the same as
in the preceding year, the figures for the two years
being annas four and pies six and annas four and
pies five, respectively. The following table shows
the average cost of each successful case of vaccination in these provinces
during the year underreport as compared with that of other provinces : —
|
Province. |
Cost of each suc- |
||
|
Rs. |
a. |
p. |
|
|
Burma .. .. .. .. .. .. |
0 |
11 |
7 |
|
Delhi.. .. .. .. .. .. .. |
0 |
6 |
10 |
|
United Provinces .. .. .. .. .. |
0 |
4 |
6 |
|
Bihar and Orissa .. .. .. .. .. .. |
0 |
2 |
1 |
|
North-West Frontier Province .. .. .. .. |
0 |
2 |
3 |
|
Punjab .. .. .. .. .. .. |
* |
||
|
Madras .. .. .. .. .. .. |
0 |
6 |
2 |
|
Bengal .. .. .. .. .. .. |
* |
||
|
Bombay .. .. .. .. .. .. |
* |
||
|
Central Provinces .. .. .. .. .. |
0 |
6 |
6 |
|
Assam .. .. .. .. .. .. |
0 |
3 |
3 |
* Information not received.
General operations.
(Statement I.)
7. During the year under report 1,433,056 persons were vaccinated—
1,431,683 by the special (district staff) and 1,373
by the dispensary staff as against 1,465,862 in the
preceding year, showing a decrease of 32,806. The
number of vaccination operations performed in 1926-27 also exhibited a
decrease of 39,260 as compared with 1925-26, the actual figures for the
two years being 1,450,044 (1,304,844 primary and 145,200 re-vaccinations)
and 1,489,304 (1,304,127 primary and 185,177 re-vaccinations), respectively.
The number of secondary operations fell from 23,442 in 1925-26 to 16,988
in 1926-27. The number and percentage of successful vaccinations in
which the results were known during 1926-27 amounted to 1,219,979 and
94.79 in the case of primary vaccinations and to 70,621 and 53.83 in the
case of re-vaccinations as against 1,208,273; 94.01; 89,381 and 53.55,
respectively, in 1925-26. Each vaccinator vaccinated on an average
1615.89 persons during the year under report as against 1650.10 in the
preceding year. The district staff successfully vaccinated 28.44 persons
per mille of the population as compared with 28.60 in 1925-26.
It will be seen that there is a decrease under all heads except in the
number and percentage of successful primary cases in which the results
were known. The decrease is chiefly due to the deputation of a number
Set display mode to: Large image | Zoom image | Transcription
Images and transcriptions on this page, including medium image downloads, may be used under the Creative Commons Attribution 4.0 International Licence unless otherwise stated. ![]()
| Permanent URL | https://digital.nls.uk/90513503 |
|---|
| Attribution and copyright: |
|
|---|


![[Page 1]](https://deriv.nls.uk/dcn4/9051/90513502.4.jpg)
