Medicine - Vaccination > 1902-1928 - Report on vaccination in the United Provinces > Vaccination United Provinces of Agra and Oudh 1923-1928 > Notes on vaccination in the United Provinces of Agra and Oudh for the year ending 31st March, 1925
(138) Page v
Download files
Individual page:
Thumbnail gallery: Grid view | List view

( v )
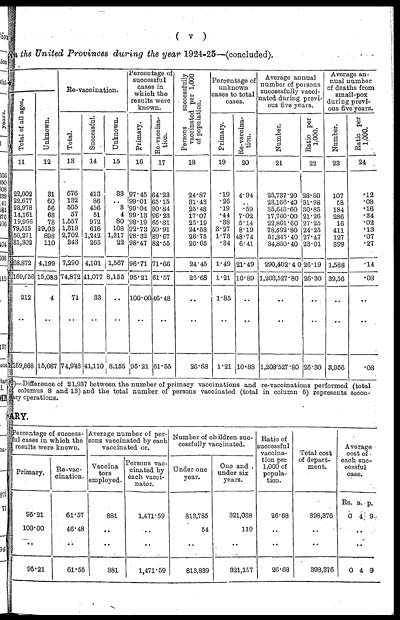
in the United Provinces during the year 1924-25—(concluded).
|
Re-vaccination. |
Percentage of |
Persons successfully |
Percentage of |
Average annual |
Average an- |
||||||||
|
Total of all ages. |
Unknown. |
||||||||||||
|
Total. |
Successful. |
Unknown. |
Primary. |
Re-vaccina- |
Primary. |
Re-vaccina- |
Number. |
Ratio per |
Number. |
Ratio per |
|||
|
11 |
12 |
13 |
14 |
15 |
16 |
17 |
18 |
19 |
20 |
21 |
22 |
23 |
24 |
|
22,002 |
31 |
676 |
413 |
33 |
97.45 |
64.23 |
24.87 |
.19 |
4.94 |
25,737.20 |
28.80 |
107 |
.12 |
|
22,677 |
60 |
132 |
86 |
.. |
99.01 |
65.15 |
31.43 |
.26 |
.. |
23,166.40 |
31.98 |
58 |
.08 |
|
28,978 |
56 |
505 |
456 |
3 |
99.04 |
90.84 |
25.48 |
.19 |
.59 |
35,648.60 |
30.85 |
184 |
.16 |
|
14,161 |
63 |
57 |
51 |
4 |
99.13 |
96.23 |
17.07 |
.44 |
7.02 |
17,760.00 |
21.26 |
286 |
.34 |
|
19,966 |
78 |
1,557 |
972 |
80 |
98.19 |
65.81 |
25.19 |
.38 |
5.14 |
22,801.60 |
27.25 |
16 |
.02 |
|
79,515 |
29,03 |
1,318 |
616 |
108 |
92.73 |
50.91 |
24.53 |
3.27 |
8.19 |
78,592.80 |
24.25 |
411 |
.13 |
|
50,271 |
898 |
2,702 |
1,242 |
1,317 |
98.32 |
89.67 |
26.75 |
1.73 |
48.74 |
51,845.40 |
27.47 |
127 |
.07 |
|
31,302 |
110 |
343 |
265 |
22 |
98.47 |
82.55 |
20.65 |
.34 |
6.41 |
34,850.40 |
23.01 |
399 |
.27 |
|
268,872 |
4,199 |
7,290 |
4,101 |
1,567 |
96.71 |
71.66 |
24.45 |
1.49 |
21.49 |
290,402.40 |
26.19 |
1,588 |
.14 |
|
1,169,656 |
15,083 |
74,872 |
41,077 |
8,155 |
95.21 |
61.57 |
25.68 |
1.21 |
10.89 |
1,208,527.80 |
26.30 |
39,56 |
.08 |
|
212 |
4 |
71 |
33 |
.. |
100.00 |
46.48 |
.. |
1.85 |
.. |
.. |
.. |
.. |
.. |
|
.. |
.. |
.. |
.. |
.. |
.. |
.. |
.. |
.. |
.. |
.. |
.. |
.. |
|
|
1,169,868 |
15,087 |
74,943 |
41,110 |
8,155 |
95.21 |
61.55 |
26.68 |
1.21 |
10.88 |
1,208,527.80 |
26.30 |
3,956 |
.08 |
(2)—Difference of 21,937 between the number of primary vaccinations and re-vaccinations performed (total
columns 8 and 13) and the total number of persons vaccinated (total in column 6) represents secon-
dary operations.
RY.
|
Percentage of success- |
Average number of per- |
Number of children suc- |
Ratio of |
Total cost |
Average |
|||||
|
Primary. |
Re-vac- |
Vaccina- |
Persons vac- |
Under one |
One and . |
|||||
|
Rs. |
a. |
p. |
||||||||
|
95.21 |
61.57 |
881 |
1,471.59 |
813,785 |
321,038 |
26.68 |
398,376 |
0 |
4 |
9 |
|
100.00 |
46.48 |
.. |
.. |
54 |
119 |
.. |
.. |
.. |
||
|
.. |
.. |
.. |
.. |
.. |
.. |
.. |
.. |
.. |
||
|
95.21 |
61.55 |
881 |
1,471.59 |
813,839 |
321,157 |
26.68 |
398,376 |
0 |
4 |
9 |
Set display mode to: Large image | Zoom image | Transcription
Images and transcriptions on this page, including medium image downloads, may be used under the Creative Commons Attribution 4.0 International Licence unless otherwise stated. ![]()
| Permanent URL | https://digital.nls.uk/90513213 |
|---|
| Attribution and copyright: |
|
|---|


