Medicine - Vaccination > 1902-1928 - Report on vaccination in the United Provinces > Vaccination United Provinces of Agra and Oudh 1902-1913 > Notes on vaccination in the United Provinces of Agra and Oudh for the year ending 31st March 1910
(349) Page 2
Download files
Individual page:
Thumbnail gallery: Grid view | List view

( 2 )
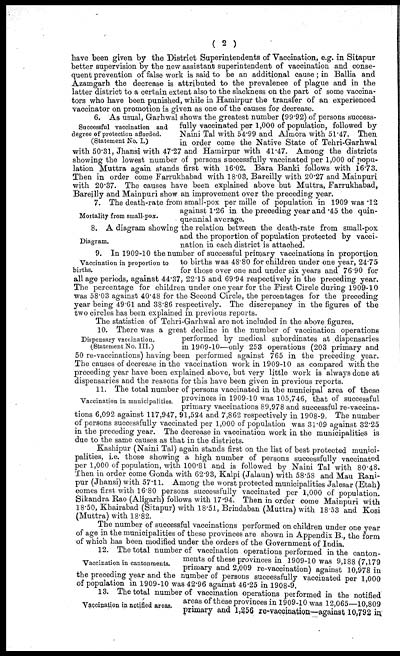
have been given by the District Superintendents of Vaccination, e.g. in Sitapur
better supervision by the new assistant superintendent of vaccination and conse-
quent prevention of false work is said to be an additional cause; in Ballia and
Azamgarh the decrease is attributed to the prevalence of plague and in the
latter district to a certain extent also to the slackness on the part of some vaccina-
tors who have been punished, while in Hamirpur the transfer of an experienced
vaccinator on promotion is given as one of the causes for decrease.
Successful vaccination and
degree of protection afforded.
(Statement No. I.)
6. As usual, Garhwal shows the greatest number (99.92) of persons success-
fully vaccinated per 1,000 of population, followed by
Naini Tal with 54.99 and Almora with 51.47. Then
in order come the Native State of Tehri-Garhwal
with 50.31, Jhansi with 47.27 and Hamirpur with 41.47. Among the districts
showing the lowest number of persons successfully vaccinated per 1,000 of popu-
lation Muttra again stands first with 16.02. Bara Banki follows with 16.73.
Then in order come Farrukhabad with 18.03, Bareilly with 20.27 and Mainpuri
with 20.37. The causes have been explained above but Muttra, Farrukhabad,
Bareilly and Mainpuri show an improvement over the preceding year.
Mortality from small-pox.
7. The death-rate from small-pox per mille of population in 1909 was .12
against 1.26 in the preceding year and .45 the quin-
quennial average.
Diagram.
8. A diagram showing the relation between the death-rate from small-pox
and the proportion of population protected by vacci-
nation in each district is attached.
Vaccination in proportion to
births.
9. In 1909-10 the number of successful primary vaccinations in proportion
to births was 48.80 for children under one year, 24.75
for those over one and under six years and 76.90 for
all age periods, against 44.37, 22.15 and 69.94 respectively in the preceding year.
The percentage for children under one year for the First Circle during 1909-10
was 58.03 against 40.48 for the Second Circle, the percentages for the preceding
year being 49.61 and 38.86 respectively. The discrepancy in the figures of the
two circles has been explained in previous reports.
The statistics of Tehri-Garhwal are not included in the above figures.
Dispensary vaccination.
(Statement No. III.)
10. There was a great decline in the number of vaccination operations
performed by medical subordinates at dispensaries
in 1909-10—only 253 operations (203 primary and
50 re-vaccinations) having been performed against 765 in the preceding year.
The causes of decrease in the vaccination work in 1909-10 as compared with the
preceding year have been explained above, but very little work is always done at
dispensaries and the reasons for this have been given in previous reports.
Vaccination in municipalities.
11. The total number of persons vaccinated in the municipal area of these
provinces in 1909-10 was 105,746, that of successful
primary vaccinations 89,978 and successful re-vaccina-
tions 6,092 against 117,947, 91,524 and 7,862 respectively in 1908-9. The number
of persons successfully vaccinated per 1,000 of population was 31.09 against 32.25
in the preceding year. The decrease in vaccination work in the municipalities is
due to the same causes as that in the districts.
Kashipur (Naini Tal) again stands first on the list of best protected munici-
palities, i.e. those showing a high number of persons successfully vaccinated
per 1,000 of population, with 100.81 and is followed by Naini Tal with 80.48.
Then in order come Gonda with 62.93, Kalpi (Jalaun) with 58.58 and Mau Rani-
pur (Jhansi) with 57.11. Among the worst protected municipalities Jalesar (Etah)
comes first with 16.80 persons successfully vaccinated per 1,000 of population.
Sikandra Rao (Aligarh) follows with 17.94. Then in order come Mainpuri with
18.50, Khairabad (Sitapur) with 18.51, Brindaban (Muttra) with 18.53 and Kosi
(Muttra) with 18.82.
The number of successful vaccinations performed on children under one year
of age in the municipalities of these provinces are shown in Appendix B., the form
of which has been modified under the orders of the Government of India
Vaccination in cantonments.
12. The total number of vaccination operations performed in the canton-
ments of these provinces in 1909-10 was 9,188 (7,179
primary and 2,009 re-vaccination) against 10,978 in
the preceding year and the number of persons successfully vaccinated per 1,000
of population in 1909-10 was 42.96 against 46.25 in 1908-9.
Vaccination in notified areas.
13. The total number of vaccination operations performed in the notified
areas of these provinces in 1909-10 was 12,065—10,809
primary and 1,256 re-vaccination—against 10,792 in.
Set display mode to: Large image | Zoom image | Transcription
Images and transcriptions on this page, including medium image downloads, may be used under the Creative Commons Attribution 4.0 International Licence unless otherwise stated. ![]()
| Permanent URL | https://digital.nls.uk/87232340 |
|---|
| Attribution and copyright: |
|
|---|


![[Page 1]](https://deriv.nls.uk/dcn4/8723/87232336.4.jpg)
