

Medicine - Vaccination > 1866-1901 - Annual report upon vaccination in the North-Western Provinces > Vaccination North-Western Provinces and Oudh 1878-1895 > 1891-1892 - Annual report on vaccination in the North-Western Provinces and Oudh for the year 1891-92
(206) Page 2
![[Page 1]](https://deriv.nls.uk/dcn4/8722/87226961.4.jpg)
Download files
Individual page:
Thumbnail gallery: Grid view | List view
( 2 )
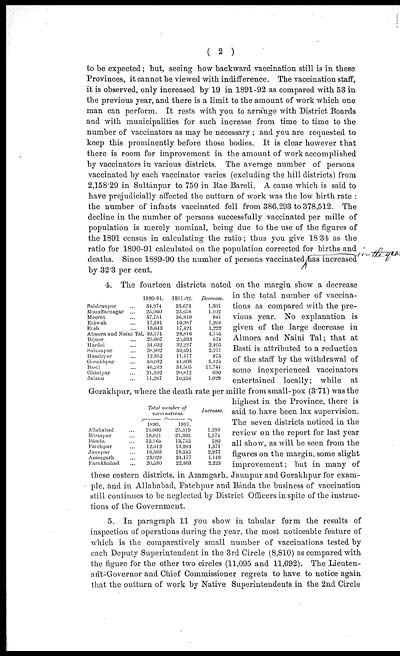
to be expected; but, seeing bow backward vaccination still is in these
Provinces, it cannot be viewed with indifference. The vaccination staff,
it is observed, only increased by 19 in 1891-92 as compared with 53 in
the previous year, and there is a limit to the amount of work which one
man can perform. It rests with you to arrange with District Boards
and with municipalities for such increase from time to time to the
number of vaccinators as may be necessary ; and you are requested to
keep this prominently before those bodies. It is clear however that
there is room for improvement in the amount of work accomplished
by vaccinators in various districts. The average number of persons
vaccinated by each vaccinator varies (excluding the hill districts) from
2,158.29 in Sultánpur to 750 in Rae Bareli. A cause which is said to
have prejudicially affected the outturn of work was the low birth rate :
the number of infants vaccinated fell from 386,293 to 378,512. The
decline in the number of persons successfully vaccinated per mille of
population is merely nominal, being due to the use of the figures of
the 1891 census in calculating the ratio; thus you give 18.34 as the
ratio for 1890-91 calculated on the population corrected for births and
deaths. Since 1889-90 the number of persons vaccinated has increased
by 323 per cent.
|
1890-91. |
1891-92. |
Decrease. |
|
|
Saháranpur ... |
34,974 |
33,673 |
1,301 |
|
Muzaffarnagar ... |
25,060 |
23,658 |
1,402 |
|
Meerut ... |
37,751 |
36,810 |
941 |
|
Etáwah ... |
17,591 |
16,387 |
1,204 |
|
Etah ... |
18,043 |
17,421 |
1,222 |
|
Almora and Naini Tal |
33,571 |
28,816 |
4,755 |
|
Bijnor ... |
25,607 |
25,033 |
574 |
|
Hardoi ... |
34,632 |
32,227 |
2,405 |
|
Sultanpur ... |
38,902 |
36,691 |
2,211 |
|
Hamírpur ... |
12,352 |
11,477 |
875 |
|
Gorakhpur ... |
50,032 |
44,608 |
5,424 |
|
Basti ... |
46,249 |
34,505 |
11,744 |
|
Gházipur ... |
21,502 |
20,812 |
690 |
|
Jalaun ... |
11,287 |
10,258 |
1,029 |
|
Total number of |
Increase. |
||
|
1890. |
1891. |
||
|
Allahabad ... |
24,060 |
25,319 |
1,259 |
|
Mirzapur ... |
19,821 |
21,395 |
1,574 |
|
Bánda ... |
13,165 |
13,755 |
590 |
|
Fatehpur ... |
12,612 |
13,983 |
1,371 |
|
Jaunpur ... |
16,568 |
19,545 |
2,977 |
|
Azamgarh ... |
23,028 |
24,177 |
1,149 |
|
Farukhabad ... |
20,580 |
22,803 |
2,223 |
4. The fourteen districts noted on the margin show a decrease
in the total number of vaccina-
tions as compared with the pre-
vious year. No explanation is
given of the large decrease in
Almora and Naini Tal; that at
Basti is attributed to a reduction
of the staff by the withdrawal of
some inexperienced vaccinators
entertained locally; while at
Gorakhpur, where the death rate per mille from small-pox (3.7l) was the
highest in the Province, there is
said to have been lax supervision.
The seven districts noticed in the
review on the report for last year
all show, as will be seen from the
figures on the margin, some slight
improvement; but in many of
these eastern districts, in Azamgarh, Jaunpur and Gorakhpur for exam-
ple, and in Allahabad, Fatehpur and Bánda the business of vaccination
still continues to be neglected by District Officers in spite of the instruc-
tions of the Government.
5. In paragraph 11 you show in tabular form the results of
inspection of operations during the year, the most noticeable feature of
which is the comparatively small number of vaccinations tested by
each Deputy Superintendent in the 3rd Circle (8,810) as compared with
the figure for the other two circles (11,095 and 11,692). The Lieuten-
ant-Governor and Chief Commissioner regrets to have to notice again
that the outturn of work by Native Superintendents in the 2nd Circle
Set display mode to: Large image | Zoom image | Transcription
Images and transcriptions on this page, including medium image downloads, may be used under the Creative Commons Attribution 4.0 International Licence unless otherwise stated. ![]()
| Permanent URL | https://digital.nls.uk/87226962 |
|---|
| Attribution and copyright: |
|
|---|
| Description | Covers 1866-1901. Appraises vaccination operations in North-Western Provinces and Oudh. Describes transition from smallpox vaccination with crusts to arm-to-arm vaccination. Lymph extracted from children replaced with animal and lanolin lymph from c.1869. Explores native objections. Tables show particulars of vaccination. Success and mortality rates noted. Colour maps and diagrams included. |
|---|---|
| Shelfmark | IP/30/VA.3 |
| Additional NLS resources: | |
| Description | The Vaccination collection consists of 66 volumes dating from 1856 to 1933. Reports show how vaccination against smallpox was implemented in India. They reveal the shift from variolation, improved vaccination techniques, logistics of lymph supply, funding and staffing. They explore how the local population viewed and resisted western vaccination. |
|---|---|
| Description | The India Papers collection contains publications of the central (Imperial) Government and many Indian states. Most states came under British rule. Much of the collection dates from between the post-Mutiny re-organisation of the Indian Government and Indian Independence in 1947. Some items published in London by John Murray. |
|---|---|
| Shelfmark | India Papers |
| Additional NLS resources: | |