

Medicine - Vaccination > 1866-1901 - Annual report upon vaccination in the North-Western Provinces > Vaccination North-Western Provinces 1866-1877 > 1872-1873 - Season of 1872-73. Returns of vaccination for the North-Western Provinces and native states of Bundelcund
(258) Page 2
![[Page 1]](https://deriv.nls.uk/dcn4/8722/87224854.4.jpg)
Download files
Individual page:
Thumbnail gallery: Grid view | List view
( 2 )
Compared with the great increase in the number of primary operations,
which were slightly more successful than last year, the increase in the
re-vaccinations, accompanied with a very much lower percentage of
success, is remarkable. Operations of this class are only common in
Kumaon, that being the only Division in which vaccination is of suffi-
ciently long standing for the children operated on to have grown up to
an age requiring its repetition. But your explanation of the want of suc-
cess, and of the fallaciousness (as you term it) of the returns, is not
understood. The supervising officers should exercise too stringent a
check to allow of the returns being largely falsified, whether this is done
intentionally or (as you seem to imply) through ignorance.
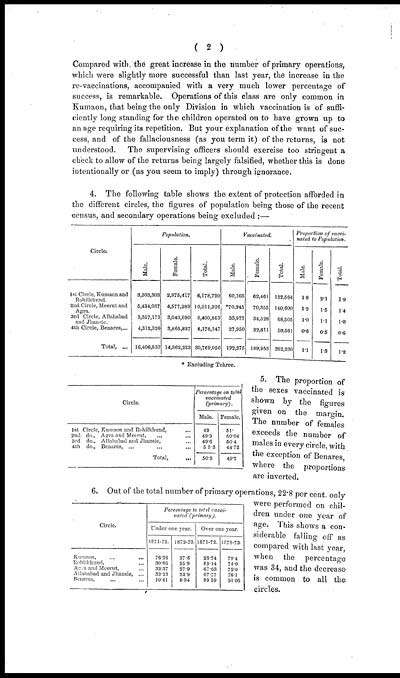
4. The following table shows the extent of protection afforded in
the different circles, the figures of population being those of the recent
census, and secondary operations being excluded :—
|
Circle. |
Population. |
Vaccinated. |
Proportion of vacci- |
||||||
|
Male. |
Female. |
Total. |
Male. |
Female. |
Total. |
Male. |
Female. |
Total. |
|
|
1st Circle, Kumaon and |
3,303,303 |
2,875,417 |
6,178,720 |
60,103 |
62,461 |
122,564 |
1.8 |
2.1 |
1.9 |
|
2nd Circle, Meerut and |
5,434,037 |
4,577,289 |
10,011,326 |
*70,245 |
70,355 |
140,600 |
1.2 |
1.5 |
1.4 |
|
3rd Circle, Allahabad |
3,357,173 |
3,043,690 |
6,400,863 |
33,977 |
34,528 |
68,505 |
1.0 |
1.1 |
1.0 |
|
4th Circle, Benares,... |
4,312,320 |
3,865,827 |
8,178,147 |
27,950 |
22,611 |
50,561 |
0.6 |
0.5 |
0.6 |
|
Total, ... |
16,406,833 |
14,362,223 |
30,769,056 |
192,275 |
189,955 |
382,230 |
1.1 |
1.3 |
1.2 |
* Excluding Tehree.
|
Circle. |
Percentage on total |
|
|
Male. |
Female. |
|
|
1st Circle, Kumaon and Rohilkhund, ... |
49 |
51 |
|
2nd do., Agra and Meerut, ... ... |
49.9 |
50.04 |
|
3rd do., Allahabad and Jhansie, ... |
49.6 |
50.4 |
|
4th do., Benares, ... ... ... |
55.3 |
44.72 |
|
Total, ... |
50.3 |
49.7 |
5. The proportion of
the sexes vaccinated is
shown by the figures
given on the margin.
The number of females
exceeds the number of
males in every circle, with
the exception of Benares,
where the proportions
are inverted.
|
Circle. |
Percentage to total vacci- |
|||
|
Under one year. |
Over one year. |
|||
|
1871-72. |
1872-73. |
1871-72. |
1872-73. |
|
|
Kumaon, ... ... |
76.26 |
27.8 |
23.74 |
72.4 |
|
Rohilkhund, ... |
30.86 |
25.9 |
69.14 |
74.0 |
|
Agra and Meerut, ... |
32.37 |
27.9 |
67.63 |
72.0 |
|
Allahabad and Jhansie, ... |
32.23 |
23.9 |
67.77 |
76.1 |
|
Benares, ... ... |
10.41 |
8.94 |
89.59 |
91.05 |
6. Out of the total number of primary operations, 22.8 per cent. only
were performed on chil-
dren under one year of
age. This shows a con-
siderable falling off as
compared with last year,
when the percentage
was 34, and the decrease
is common to all the
circles.
Set display mode to: Large image | Zoom image | Transcription
Images and transcriptions on this page, including medium image downloads, may be used under the Creative Commons Attribution 4.0 International Licence unless otherwise stated. ![]()
| Permanent URL | https://digital.nls.uk/87224855 |
|---|
| Attribution and copyright: |
|
|---|
| Description | Covers 1866-1901. Appraises vaccination operations in North-Western Provinces and Oudh. Describes transition from smallpox vaccination with crusts to arm-to-arm vaccination. Lymph extracted from children replaced with animal and lanolin lymph from c.1869. Explores native objections. Tables show particulars of vaccination. Success and mortality rates noted. Colour maps and diagrams included. |
|---|---|
| Shelfmark | IP/30/VA.3 |
| Additional NLS resources: | |
| Description | The Vaccination collection consists of 66 volumes dating from 1856 to 1933. Reports show how vaccination against smallpox was implemented in India. They reveal the shift from variolation, improved vaccination techniques, logistics of lymph supply, funding and staffing. They explore how the local population viewed and resisted western vaccination. |
|---|---|
| Description | The India Papers collection contains publications of the central (Imperial) Government and many Indian states. Most states came under British rule. Much of the collection dates from between the post-Mutiny re-organisation of the Indian Government and Indian Independence in 1947. Some items published in London by John Murray. |
|---|---|
| Shelfmark | India Papers |
| Additional NLS resources: | |