Medicine - Vaccination > 1867-1929 - Report on vaccination in the Punjab > Vaccination in the Punjab 1919-1929 > 1926-1929 - Report on vaccination in the Punjab for the year 1928-29 and for the triennium 1926-29
(424) Page vi
Download files
Individual page:
Thumbnail gallery: Grid view | List view

vi
A—VACCINE
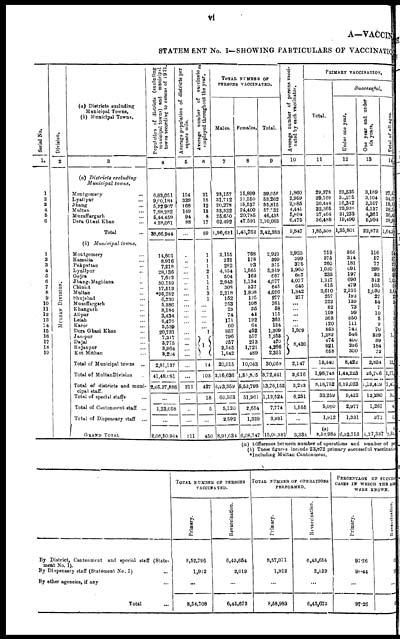
STATEMENT No. I—SHOWING PARTICULARS OF VACCINATION
|
Serial No. |
Division. |
(a) Districts excluding Municipal Towns. |
Population of districts (excluding |
Average population of districts per |
Average number of vaccinators |
TOTAL NUMBER OF |
Average number of persons vacci- |
PRIMARY VACCINATION. |
|||||
|
Total. |
Successful. |
||||||||||||
|
Males. |
Females. |
Total. |
Under one year. |
One year and under |
Total of all ages. |
||||||||
|
1 |
2 |
3 |
4 |
5 |
6 |
7 |
8 |
9 |
10 |
11 |
12 |
13 |
14 |
|
MULTAN DIVISION. |
(a) Districts excluding |
||||||||||||
|
1 |
Montgomery ... |
6,83,051 |
154 |
21 |
23,157 |
15,899 |
39,056 |
1,860 |
29,378 |
23,535 |
3,169 |
27,41 |
|
|
2 |
Lyallpur ... |
9,00,184 |
339 |
18 |
31,712 |
21,550 |
53,262 |
2,959 |
39,169 |
31, 275 |
3,104 |
34,67 |
|
|
3 |
Jhang ... |
5,22,907 |
168 |
12 |
20,278 |
15,537 |
35,815 |
2,985 |
20,444 |
16,342 |
2,107 |
19,15 |
|
|
4 |
Multan ... |
7,88,282 |
149 |
13 |
33,332 |
24,400 |
57,732 |
4,441 |
32,365 |
23,926 |
4,137 |
28,34 |
|
|
5 |
Muzaffargarh ... |
5,44,459 |
94 |
8 |
25,650 |
20,785 |
46,435 |
5,805 |
27,464 |
21,233 |
4,361 |
26,46 |
|
|
6 |
Dera Ghazi Khan ... |
4,28,061 |
88 |
17 |
62,492 |
47,591 |
1,10,083 |
6,475 |
36,488 |
19,490 |
5,994 |
28,92 |
|
|
Total ... |
38,66,944 |
... |
89 |
1,96,621 |
1,45,762 |
3,42,383 |
3,847 |
1,85,308 |
1,35,801 |
22,872 |
1,64,98 |
||
|
(b) Municipal towns. |
|||||||||||||
|
1 |
Montgomery ... |
14,601 |
... |
1 |
2,155 |
768 |
2,923 |
2,923 |
759 |
366 |
116 |
54 |
|
|
2 |
Kamalia ... |
8,916 |
... |
1 |
221 |
178 |
399 |
399 |
375 |
314 |
57 |
374 |
|
|
3 |
Pakpattan ... |
7,218 |
... |
1 |
282 |
93 |
375 |
375 |
260 |
181 |
77 |
260 |
|
|
4 |
Lyallpur ... |
28,136 |
... |
2 |
4,354 |
1,565 |
5,919 |
2,960 |
1,020 |
691 |
299 |
95 |
|
|
5 |
Gojra ... |
7,622 |
... |
1 |
504 |
163 |
667 |
667 |
233 |
197 |
32 |
23 |
|
|
6 |
Jhang-Maghiana ... |
30,139 |
... |
1 |
2,943 |
1,134 |
4,077 |
4,077 |
1,217 |
690 |
312 |
1,01 |
|
|
7 |
Chiniot ... |
17,513 |
... |
1 |
308 |
337 |
645 |
645 |
615 |
479 |
105 |
58 |
|
|
8 |
Multan ... |
*95,252 |
... |
3 |
2,218 |
1,808 |
4,026 |
1,342 |
3,610 |
2,316 |
1,030 |
3,44 |
|
|
9 |
Shujabad ... |
6,730 |
... |
1 |
152 |
125 |
277 |
277 |
257 |
193 |
27 |
22 |
|
|
10 |
Muzaffargarh ... |
5,386 |
... |
... |
253 |
108 |
361 |
... |
222 |
139 |
54 |
21 |
|
|
11 |
Khangarh ... |
3,184 |
... |
... |
23 |
35 |
58 |
... |
82 |
73 |
7 |
8 |
|
|
12 |
Alipur ... |
3,434 |
... |
... |
74 |
41 |
115 |
... |
109 |
99 |
10 |
13 |
|
|
13 |
Leiah ... |
8,476 |
... |
... |
171 |
192 |
363 |
... |
363 |
350 |
5 |
3 |
|
|
14 |
Karor ... |
3,539 |
... |
... |
60 |
64 |
124 |
... |
120 |
111 |
9 |
1 |
|
|
15 |
Dera Ghazi Khan ... |
20,731 |
... |
1 |
857 |
452 |
1,309 |
1,309 |
863 |
742 |
70 |
8 |
|
|
16 |
Jampur ... |
7,317 |
... |
1 |
796 |
557 |
1,353 |
8,420 |
1,282 |
546 |
329 |
1,1 |
|
|
17 |
Dajal ... |
5,775 |
... |
257 |
213 |
470 |
474 |
400 |
39 |
... |
|||
|
18 |
Rajanpur ... |
3,964 |
... |
2,545 |
1,721 |
4,266 |
921 |
236 |
184 |
... |
|||
|
19 |
Kot Mithan ... |
3,204 |
... |
1,842 |
489 |
2,331 |
658 |
300 |
72 |
... |
|||
|
Total of Municipal towns ... |
2,81,137 |
... |
14 |
20,015 |
10,043 |
30,058 |
2,147 |
13,440 |
8,422 |
2,834 |
12, |
||
|
Total of Multan Division ... |
41,48,081 |
... |
103 |
2,16,636 |
1,55,805 |
3,72,441 |
3,616 |
1,98,748 |
1,44,223 |
25,706 |
1,77, |
||
|
Total of districts and muni- cipal staff. |
2,05,27,886 |
211 |
427 |
8,23,359 |
5,52,793 |
13,76,152 |
3,223 |
8,18,752 |
6,19,023 |
1,13,419 |
7,47 |
||
|
Total of special staffs ... |
... |
... |
18 |
60,563 |
51,961 |
1,12,524 |
6,251 |
33,259 |
9,422 |
12,280 |
30, |
||
|
Total of Cantonment staff ... |
1,23,058 |
... |
5 |
5,120 |
2,654 |
7,774 |
1,555 |
5,060 |
2,977 |
1,267 |
4, |
||
|
Total of Dispensary staff ... |
... |
... |
... |
2,592 |
1,339 |
3,931 |
... |
1,912 |
1,331 |
371 |
1, |
||
|
GRAND TOTAL ... |
2,06,50,944 |
211 |
450 |
8,91,634 |
6,08,747 |
15,00,881 |
3,334 |
(a) 8,58,983 |
6,32,753 |
1,27,337 |
7,83, |
||
(a) Difference between number of operations and number of pe
(b) These figures include 23,872 primary successful vaccinatio
*including Multan Cantonment.
|
TOTAL NUMBER OF PERSONS |
TOTAL NUMBER OF OPERATIONS |
PERCENTAGE OF SUCCESS WERE KNOWN. |
||||
|
Primary. |
Revaccination. |
Primary. |
Revaccination. |
Primary. |
Revaccination. |
|
|
By District, Cantonment and special staff (State- |
8,52,796 |
6,43,654 |
8,57,071 |
6,43,654 |
97.26 |
69 |
|
By Dispensary staff (Statement No. I) ... |
1,912 |
2,019 |
1,912 |
2,019 |
98.44 |
75 |
|
By other agencies, if any ... |
... |
... |
... |
... |
... |
... |
|
Total ... |
8,54,708 |
6,45,673 |
8,58,983 |
6,45,673 |
97.26 |
6 |
Set display mode to: Large image | Zoom image | Transcription
Images and transcriptions on this page, including medium image downloads, may be used under the Creative Commons Attribution 4.0 International Licence unless otherwise stated. ![]()
| Permanent URL | https://digital.nls.uk/87223986 |
|---|
| Attribution and copyright: |
|
|---|


