Medicine - Vaccination > 1867-1929 - Report on vaccination in the Punjab > Vaccination in the Punjab 1905-1918 > 1916-1917 - Report on vaccination in the Punjab for the year 1916-17
(451) Page xiv
Download files
Individual page:
Thumbnail gallery: Grid view | List view

xiv
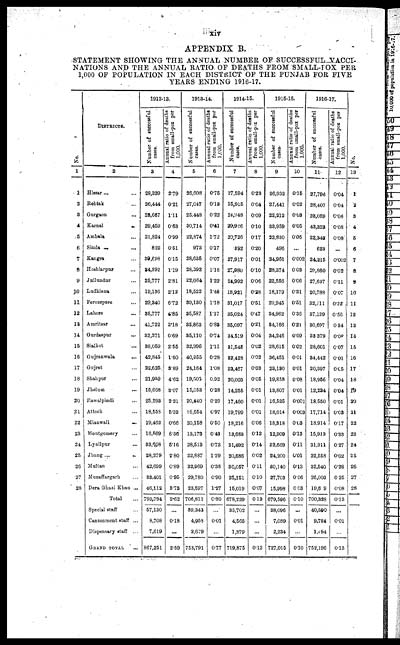
APPENDIX B.
STATEMENT SHOWING THE ANNUAL NUMBER OF SUCCESSFUL VACCI-
NATIONS AND THE ANNUAL RATIO OF DEATHS FROM SMALL-POX PER
1,000 OF POPULATION IN EACH DISTRICT OF THE PUNJAB FOR FIVE
YEARS ENDING 1916-17.
|
No. |
DISTRICTS. |
1912-13. |
1913-14. |
1914-15. |
1915-16. |
1916-17. |
No. |
|||||
|
Number of successful |
Annual ratio of deaths |
Number of successful |
Annual ratio of deaths |
Number of successful |
Annual ratio of deaths |
Number of successful |
Annual ratio of deaths |
Number of successful |
Annual ratio of deaths |
|||
|
1 |
2 |
3 |
4 |
5 |
6 |
7 |
8 |
9 |
10 |
11 |
12 |
13 |
|
1 |
Hissar ... ... |
28,329 |
2.79 |
26,608 |
0.75 |
27,594 |
0.23 |
26,932 |
0.15 |
27,796 |
0.04 |
1 |
|
2 |
Rohtak ... ... |
26,444 |
0.21 |
27,047 |
0.13 |
25,915 |
0.04 |
27,441 |
0.02 |
28,407 |
0.04 |
2 |
|
3 |
Gurgaon ... ... |
23,667 |
1.11 |
25,448 |
0.22 |
24,948 |
0.09 |
22,212 |
0.03 |
28,059 |
0.08 |
3 |
|
4 |
Karnal ... ... |
29,459 |
0.63 |
30,714 |
0.41 |
29,926 |
0.10 |
33,959 |
0.05 |
43,323 |
0.08 |
4 |
|
5 |
Ambala ... ... |
21,824 |
0.99 |
22,874 |
1.72 |
20,726 |
0.17 |
22,830 |
0.06 |
22,342 |
0.08 |
5 |
|
6 |
Simla ... ... |
822 |
0.51 |
973 |
0.17 |
892 |
0.20 |
496 |
... |
623 |
... |
6 |
|
7 |
Kangra ... ... |
39,698 |
0.15 |
28,635 |
0.07 |
27,917 |
0.01 |
24,961 |
0.002 |
24,215 |
0.002 |
7 |
|
8 |
Hoshiarpur ... ... |
34,392 |
1.19 |
28,392 |
1.16 |
27,980 |
0.10 |
28,374 |
0.03 |
29,860 |
0.02 |
8 |
|
9 |
Jullundur ... ... |
25,777 |
2.81 |
22,064 |
1.22 |
24,992 |
0.06 |
22,556 |
0.06 |
27,637 |
0.11 |
9 |
|
10 |
Ludhiana ... ... |
19,136 |
2.12 |
18,522 |
1.48 |
18,921 |
0.28 |
18,179 |
0.31 |
20,788 |
0.07 |
10 |
|
11 |
Ferozepore ... ... |
29,340 |
6.72 |
30,130 |
1.18 |
31,017 |
0.51 |
29,945 |
0.51 |
32,111 |
0.23 |
11 |
|
12 |
Lahore ... ... |
35,777 |
4.85 |
35,587 |
1.17 |
35,024 |
0.47 |
34,962 |
0.36 |
37,139 |
0.56 |
12 |
|
13 |
Amritsar ... ... |
41,722 |
2.18 |
33,863 |
0.88 |
35,097 |
0.21 |
34,166 |
0.21 |
30,697 |
0.34 |
13 |
|
14 |
Gurdaspur ... ... |
32,271 |
0.69 |
35,110 |
0.74 |
34,519 |
0.04 |
34,246 |
0.09 |
33,379 |
0.08 |
14 |
|
15 |
Sialkot ... ... |
88,059 |
2.55 |
32,996 |
1.11 |
31,545 |
0.02 |
28,615 |
0.02 |
28,601 |
0.07 |
15 |
|
16 |
Gujranwala ... ... |
42,845 |
1.60 |
40,955 |
0.28 |
32,428 |
0.02 |
36,451 |
0.01 |
34,442 |
0.01 |
16 |
|
17 |
Gujrat ... ... |
22,625 |
3.89 |
24,164 |
1.08 |
23,467 |
0.03 |
23,130 |
0.01 |
20,397 |
0.05 |
17 |
|
18 |
Shahpur ... ... |
21,959 |
4.62 |
19,505 |
0.92 |
20,003 |
0.05 |
19,858 |
0.08 |
18,956 |
0.04 |
18 |
|
19 |
Jhelum ... ... |
15,668 |
3.07 |
15,058 |
0.28 |
14,255 |
0.01 |
13,807 |
0.01 |
12,234 |
0.04 |
19 |
|
20 |
Rawalpindi ... ... |
25,293 |
2.21 |
20,440 |
0.29 |
17,460 |
0.01 |
16,525 |
0.001 |
18,550 |
0.01 |
20 |
|
21 |
Attock ... ... |
18,558 |
5.33 |
16,654 |
0.97 |
19,799 |
0.01 |
18,014 |
0.003 |
17,714 |
0.03 |
21 |
|
22 |
Mianwali ... ... |
19,462 |
0.66 |
20,158 |
0.50 |
18,216 |
0.06 |
18,318 |
0.03 |
18,914 |
0.17 |
22 |
|
23 |
Montgomery ... ... |
16,569 |
6.36 |
13,173 |
0.43 |
13,683 |
0.12 |
12,909 |
0.13 |
15,913 |
0.33 |
23 |
|
24 |
Lyallpur ... ... |
83,608 |
5.16 |
28,513 |
0.73 |
31,492 |
0.14 |
32,669 |
0.11 |
31,911 |
0.27 |
24 |
|
25 |
Jhang ... ... |
28,279 |
2.80 |
22,837 |
1.29 |
20,686 |
0.02 |
24,200 |
0.01 |
22,558 |
0.02 |
25 |
|
26 |
Multan ... ... |
42,699 |
0.89 |
32,969 |
0.38 |
30,057 |
0.11 |
80,140 |
0.13 |
32,540 |
0.28 |
26 |
|
27 |
Muzaffargarh ... ... |
33,401 |
0.95 |
29,780 |
0.90 |
25,151 |
0.10 |
27,703 |
0.06 |
26,003 |
0.25 |
27 |
|
28 |
Dera Ghazi Khan ... |
46,112 |
3.73 |
23,597 |
1.27 |
15,019 |
0.07 |
15,998 |
0.03 |
19,6 9 |
0.08 |
28 |
|
Total ... |
793,794 |
2.62 |
706,811 |
0.80 |
678,229 |
0.13 |
679,596 |
0.10 |
700,328 |
0.13 |
||
|
Special Staff ... |
57,130 |
... |
39,343 |
... |
35,702 |
... |
38,096 |
... |
40,590 |
... |
||
|
Cantonment staff ... |
8,708 |
0.18 |
4,958 |
0.01 |
4,565 |
... |
7,089 |
0.01 |
9,784 |
0.01 |
||
|
Dispensary staff ... |
7,619 |
... |
2,679 |
... |
1,379 |
... |
2,234 |
... |
1,094 |
|||
|
GRAND TOTAL ... |
867,251 |
2.59 |
753,791 |
0.77 |
719,875 |
0.12 |
727,015 |
0.10 |
752,196 |
0.13 |
||
Set display mode to: Large image | Zoom image | Transcription
Images and transcriptions on this page, including medium image downloads, may be used under the Creative Commons Attribution 4.0 International Licence unless otherwise stated. ![]()
| India Papers > Medicine - Vaccination > Report on vaccination in the Punjab > Vaccination in the Punjab 1905-1918 > Report on vaccination in the Punjab for the year 1916-17 > (451) Page xiv |
|---|
| Permanent URL | https://digital.nls.uk/87221471 |
|---|
| Attribution and copyright: |
|
|---|


