Medicine - Vaccination > 1867-1929 - Report on vaccination in the Punjab > Vaccination in the Punjab 1905-1918 > 1912-1913 - Notes on vaccination in the Punjab for the year 1912-13
(300) Page vii
Download files
Individual page:
Thumbnail gallery: Grid view | List view

vii
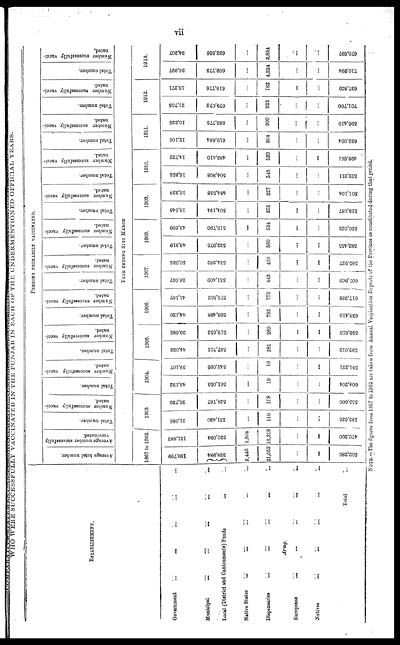
WHO WERE SUCCESSFULLY VACCINATED IN THE PUNJAB IN EACH OF THE UNDERMENTIONED OFFICIAL YEARS.
|
ESTABLISHMENT. |
PERSONS PRIMARILY VACCINATED. |
|||||||||||||||||||||||
|
Average total number. |
Average number successfully |
Total number. |
Number successfully vacci- |
Total number. |
Number successfully vacci- |
Total number. |
Number successfully vacci- |
Total number. |
Number successfully vacci- |
Total number. |
Number successfully vacci- |
Total number. |
Number successfully vacci- |
Total number. |
Number successfully vacci- |
Total number. |
Number successfully vacci- |
Total number. |
Number successfully vacci- |
Total number. |
Number successfully vacci- |
Total number. |
Number successfully vacci- |
|
|
YEAR ENDING 31ST MARCH |
||||||||||||||||||||||||
|
1867 to 1902. |
1903. |
1904. |
1905. |
1906. |
1907. |
1908. |
1909. |
1910. |
1911. |
1912. |
1913. |
|||||||||||||
|
Government ... ... ... ... ... |
139,799 |
131,883 |
31,086 |
26,730 |
43,132 |
39,107 |
44,033 |
39,685 |
44,120 |
41,107 |
56,057 |
50,635 |
48,919 |
43,699 |
18,648 |
16,339 |
16,855 |
14,722 |
12,106 |
10,335 |
21,705 |
18,271 |
36,997 |
34,207 |
|
Municipal ... ... ... ... ... |
338,984 |
320,094 |
551,430 |
528,767 |
561,053 |
542,095 |
537,705 |
519,652 |
593,498 |
575,502 |
551,409 |
534,882 |
532,976 |
515,790 |
504,184 |
484,538 |
504,808 |
483,410 |
619,684 |
585,775 |
679,072 |
618,776 |
669,773 |
632,656 |
|
Local (District and Cantonments) Funds ... ... |
||||||||||||||||||||||||
|
Native States ... ... ... ... ... |
2,445 |
1,904 |
... |
... |
... |
... |
... |
... |
... |
... |
... |
... |
... |
... |
... |
... |
... |
... |
... |
... |
... |
... |
... |
... |
|
Dispensaries ... ... ... ... ... |
21,052 |
16,319 |
110 |
109 |
19 |
19 |
281 |
269 |
792 |
779 |
443 |
410 |
560 |
534 |
255 |
227 |
548 |
529 |
304 |
300 |
923 |
782 |
4,224 |
3,834 |
|
Army. |
... |
... |
... |
... |
... |
... |
... |
... |
... |
... |
... |
... |
... |
... |
... |
... |
... |
... |
... |
... |
... |
... |
... |
... |
|
Natives ... ... ... ... ... |
... |
... |
... |
... |
... |
... |
... |
... |
... |
... |
... |
... |
... |
... |
... |
... |
... |
... |
... |
... |
... |
... |
... |
... |
|
Total ... |
502,280 |
470,200 |
582,626 |
555,606 |
604,204 |
581,221 |
582,019 |
559,606 |
638,410 |
617,388 |
607,909 |
585,927 |
582,455 |
560,023 |
523,087 |
501,104 |
522,211 |
498,661 |
632,094 |
596,410 |
701,700 |
637,829 |
710,994 |
670,697 |
NOTE.—The figures from 1867 to 1902 are taken from Annual Vaccination Reports of the Province as constituted during that period.
Set display mode to: Large image | Zoom image | Transcription
Images and transcriptions on this page, including medium image downloads, may be used under the Creative Commons Attribution 4.0 International Licence unless otherwise stated. ![]()
| India Papers > Medicine - Vaccination > Report on vaccination in the Punjab > Vaccination in the Punjab 1905-1918 > Notes on vaccination in the Punjab for the year 1912-13 > (300) Page vii |
|---|
| Permanent URL | https://digital.nls.uk/87220885 |
|---|
| Attribution and copyright: |
|
|---|


