

Medicine - Vaccination > 1867-1929 - Report on vaccination in the Punjab > Vaccination in the Punjab 1905-1918 > 1911-1912 - Notes on vaccination in the Punjab for the year 1911-12
(262) Page ii
‹‹‹ prev (261)
Half title page
Download files
Individual page:
Thumbnail gallery: Grid view | List view
ii
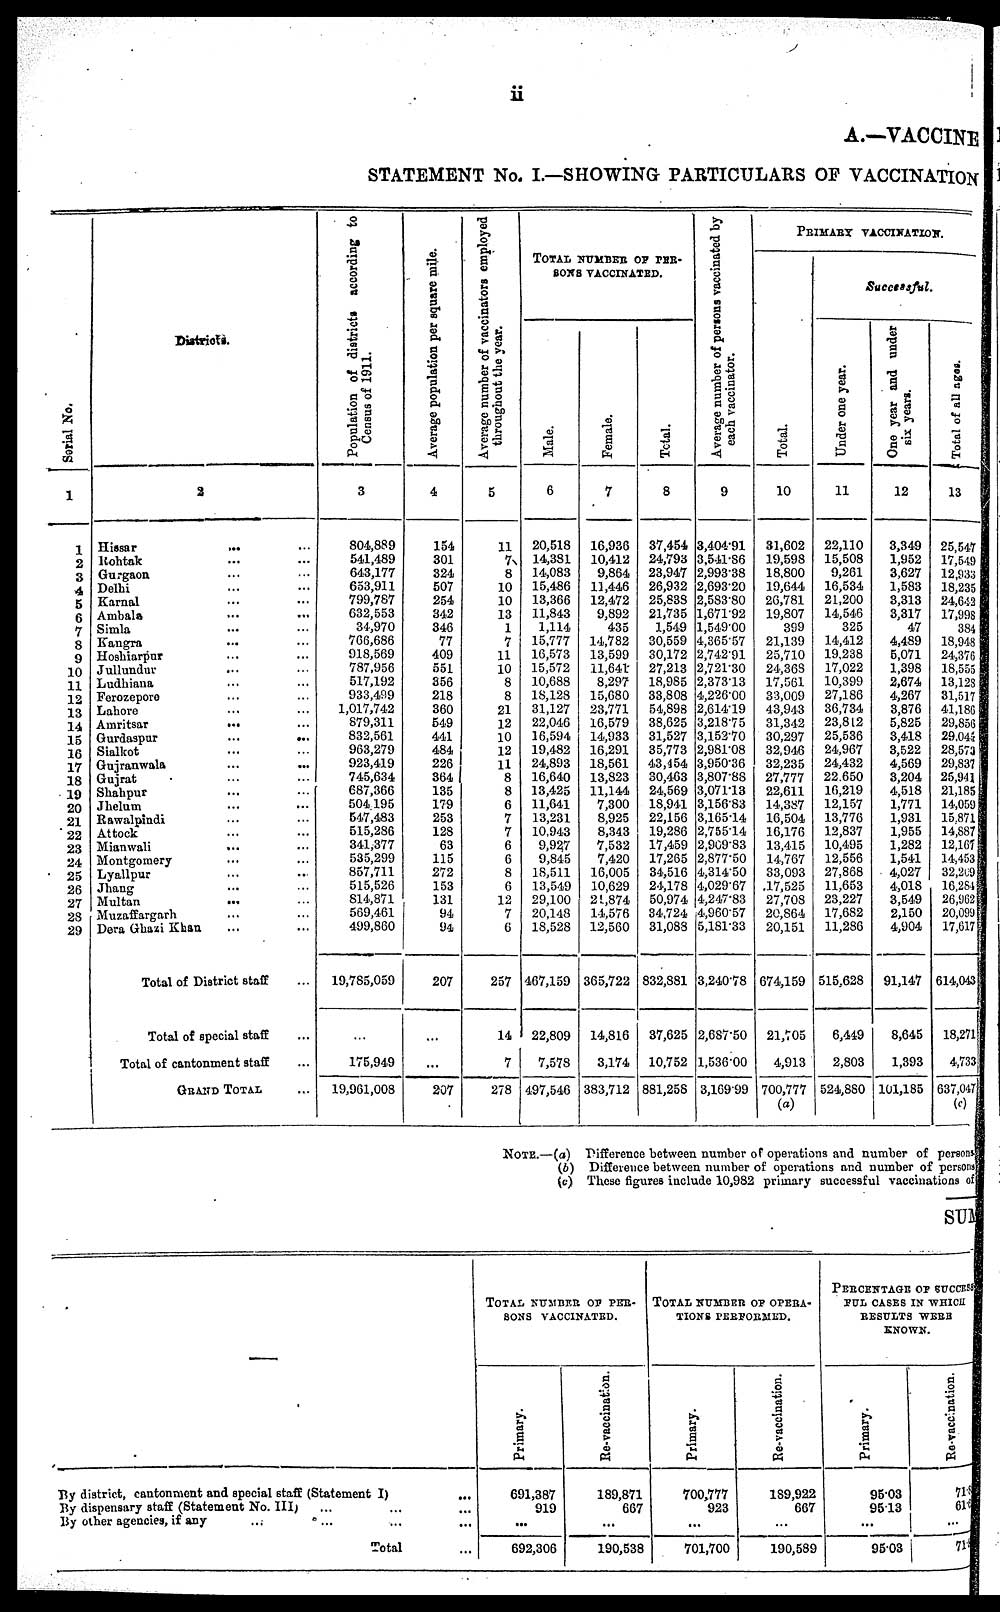
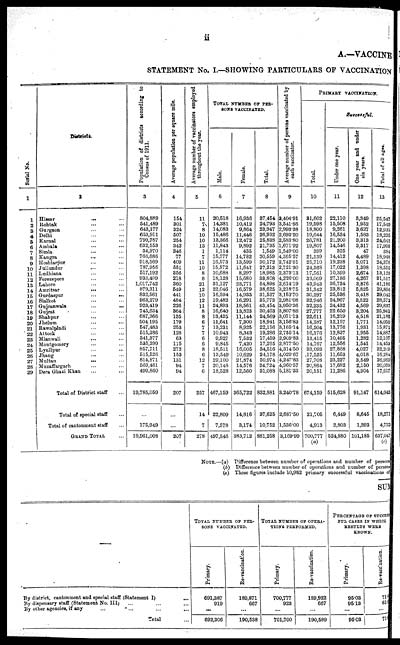
A.—VACCINE
STATEMENT No. I.—SHOWING PARTICULARS OF VACCINATION
|
Serial No. |
Diatricts. |
Population of districts according to |
Average population per square mile. |
Average number of vaccinators employed |
TOTAL NUMBER OF PER- |
Average number of persons vaccinated by |
PRIMARY VACCINATION. |
|||||
|
Total. |
Successful. |
|||||||||||
|
Male. |
Female. |
Total. |
Under one year. |
One year and under |
Total of all ages. |
|||||||
|
1 |
2 |
3 |
4 |
5 |
6 |
7 |
8 |
9 |
10 |
11 |
12 |
13 |
|
1 |
Hissar ... ... |
804,889 |
154 |
11 |
20,518 |
16,936 |
37,454 |
3,404.91 |
31,602 |
22,110 |
3,349 |
25,547 |
|
2 |
Rohtak ... ... |
541,489 |
301 |
7 |
14,381 |
10,412 |
24,793 |
3,541.86 |
19,598 |
15,508 |
1,952 |
17,549 |
|
3 |
Gurgaon ... ... |
643,177 |
324 |
8 |
14,083 |
9,864 |
23,947 |
2,993.38 |
18,800 |
9,261 |
3,627 |
12,933 |
|
4 |
Delhi ... ... |
653,911 |
507 |
10 |
15,486 |
11,446 |
26,932 |
2,693.20 |
19,644 |
16,534 |
1,583 |
18,235 |
|
5 |
Karnal ... ... |
799,787 |
254 |
10 |
13,366 |
12,472 |
25,838 |
2,583.80 |
26,781 |
21,200 |
8,313 |
24,642 |
|
6 |
Ambala ... ... |
632,553 |
342 |
13 |
11,843 |
9,892 |
21,735 |
1,671.92 |
19,807 |
14,546 |
3,317 |
17,998 |
|
7 |
Simla ... ... |
34,970 |
346 |
1 |
1,114 |
435 |
1,549 |
1,549.00 |
399 |
325 |
47 |
384 |
|
8 |
Kangra ... ... |
766,686 |
77 |
7 |
15,777 |
14,782 |
30,559 |
4,365.57 |
21,139 |
14,412 |
4,489 |
18,948 |
|
9 |
Hoshiarpur ... ... |
918,569 |
409 |
11 |
16,573 |
13,599 |
30,172 |
2,742.91 |
25,710 |
19,238 |
5,071 |
24,376 |
|
10 |
Jullundur ... ... |
787,956 |
551 |
10 |
15,572 |
11,641 |
27,213 |
2,721.30 |
24,368 |
17,022 |
1,398 |
18,555 |
|
11 |
Ludhiana ... ... |
517,192 |
356 |
8 |
10,688 |
8,297 |
18,985 |
2,373.13 |
17,561 |
10,399 |
2,674 |
13,128 |
|
12 |
Ferozepore ... ... |
933,499 |
218 |
8 |
18,128 |
15,680 |
33,808 |
4,226.00 |
33,009 |
27,186 |
4,267 |
31,517 |
|
13 |
Lahore ... ... |
1,017,742 |
360 |
21 |
31,127 |
23,771 |
54,898 |
2,614.19 |
43,943 |
36,734 |
3,876 |
41,186 |
|
14 |
Amritsar ... ... |
879,311 |
549 |
12 |
22,046 |
16,579 |
38,625 |
3,218.75 |
31,342 |
23,812 |
5,825 |
29,856 |
|
15 |
Gurdaspur ... ... |
832,561 |
441 |
10 |
16,594 |
14,933 |
31,527 |
3,152.70 |
30,297 |
25,536 |
3,418 |
29,041 |
|
16 |
Sialkot ... ... |
963,279 |
484 |
12 |
19,482 |
16,291 |
35,773 |
2,981.08 |
32,946 |
24,967 |
3,522 |
28,573 |
|
17 |
Gujranwala ... ... |
923,419 |
226 |
11 |
24,893 |
18,561 |
43,454 |
3,950.36 |
32,235 |
24,432 |
4,569 |
29,837 |
|
18 |
Gujrat ... ... |
745,634 |
364 |
8 |
16,640 |
13,823 |
30,463 |
3,807.88 |
27,777 |
22,650 |
3,204 |
25,941 |
|
19 |
Shahpur ... ... |
687,366 |
135 |
8 |
13,425 |
11,144 |
24,569 |
3,071.13 |
22,611 |
16,219 |
4,518 |
21,185 |
|
20 |
Jhelum ... ... |
504,195 |
179 |
6 |
11,641 |
7,300 |
18,941 |
3,156.83 |
14,387 |
12,157 |
1,771 |
14,059 |
|
21 |
Rawalpindi ... ... |
547,483 |
253 |
7 |
13,231 |
8,925 |
22,156 |
3,165.14 |
16,504 |
13,776 |
1,931 |
15,871 |
|
22 |
Attock ... ... |
515,286 |
128 |
7 |
10,943 |
8,343 |
19,286 |
2,755.14 |
16,176 |
12,837 |
1,955 |
14,887 |
|
23 |
Mianwali ... ... |
341,377 |
63 |
6 |
9,927 |
7,532 |
17,459 |
2,909.83 |
13,415 |
10,495 |
1,282 |
12,167 |
|
24 |
Montgomery ... ... |
535,299 |
115 |
6 |
9,845 |
7,420 |
17,265 |
2,877.50 |
14,767 |
12,556 |
1,541 |
14,453 |
|
25 |
Lyallpur ... ... |
857,711 |
272 |
8 |
18,511 |
16,005 |
34,516 |
4,314.50 |
33,093 |
27,868 |
4,027 |
32,209 |
|
26 |
Jhang ... ... |
515,526 |
153 |
6 |
13,549 |
10,629 |
24,178 |
4,029.67 |
17,525 |
11,653 |
4,018 |
16,284 |
|
27 |
Multan ... ... |
814,871 |
131 |
12 |
29,100 |
20,874 |
50,974 |
4,247.83 |
27,708 |
23,227 |
3,549 |
26,962 |
|
28 |
Muzaffargarh ... ... |
569,461 |
94 |
7 |
20,148 |
14,576 |
34,724 |
4,960.57 |
20,864 |
17,682 |
2,150 |
20,099 |
|
29 |
Dera Ghazi Khan ... ... |
499,860 |
94 |
6 |
18,528 |
12,560 |
31,088 |
5,181.33 |
20,151 |
11,286 |
4,904 |
17,617 |
|
Total of District staff ... |
19,785,059 |
207 |
257 |
467,159 |
365,722 |
832,881 |
3,240.78 |
674,159 |
515,628 |
91,147 |
614,043 |
|
|
Total of special staff ... |
... |
14 |
22,809 |
14,816 |
37,625 |
2,687.50 |
21,705 |
6,449 |
8,645 |
18,271 |
||
|
Total of cantonment staff ... |
175,949 |
... |
7 |
7,578 |
3,174 |
10,752 |
1,536.00 |
4,913 |
2,803 |
1,393 |
4,733 |
|
|
GRAND TOTAL ... |
19,961,008 |
207 |
278 |
497,546 |
383,712 |
881,258 |
3,169.99 |
700,777 |
524,880 |
101,185 |
637,047 |
|
NOTE.—(a) Difference between number of operations and number of persons.
(b) Difference between number of operations and number of persons
(c) These figures include 10,982 primary successful vaccinations of
SUM
|
TOTAL NUMBER OF PER- |
TOTAL NUMBER OF OPEBA- |
PERCENTAGE OF SUCCESS |
||||
|
Primary. |
Re-vaccination. |
Primary. |
Re-vaccination. |
Primary. |
Re-vaccination. |
|
|
By district, cantonment and special staff (Statement I) ... |
691,387 |
189,871 |
700,777 |
189,922 |
95.03 |
71.8 |
|
By dispensary staff (Statement No. III) ... ... ... |
919 |
667 |
923 |
667 |
95.13 |
61.0 |
|
By other agencies, if any ... ... ... |
... |
... |
... |
... |
... |
|
|
Total ... |
692,306 |
190,538 |
701,700 |
190,589 |
95.03 |
71.8 |
Set display mode to: Large image | Zoom image | Transcription
Images and transcriptions on this page, including medium image downloads, may be used under the Creative Commons Attribution 4.0 International Licence unless otherwise stated. ![]()
| India Papers > Medicine - Vaccination > Report on vaccination in the Punjab > Vaccination in the Punjab 1905-1918 > Notes on vaccination in the Punjab for the year 1911-12 > (262) Page ii |
|---|
| Permanent URL | https://digital.nls.uk/87220767 |
|---|
| Attribution and copyright: |
|
|---|
| Description | Covers 1867-1929. Details and appraises vaccination operations in the Punjab. Describes transition from smallpox vaccination with crusts to arm-to-arm vaccination. Lymph extracted from children replaced with animal and lanolin lymph from c.1869. Extensive tables show particulars of vaccination. Success and mortality rates noted. Colour diagrams included. |
|---|---|
| Shelfmark | IP/32/VA.3 |
| Additional NLS resources: | |
| Description | The Vaccination collection consists of 66 volumes dating from 1856 to 1933. Reports show how vaccination against smallpox was implemented in India. They reveal the shift from variolation, improved vaccination techniques, logistics of lymph supply, funding and staffing. They explore how the local population viewed and resisted western vaccination. |
|---|---|
| Description | The India Papers collection contains publications of the central (Imperial) Government and many Indian states. Most states came under British rule. Much of the collection dates from between the post-Mutiny re-organisation of the Indian Government and Indian Independence in 1947. Some items published in London by John Murray. |
|---|---|
| Shelfmark | India Papers |
| Additional NLS resources: | |