Medicine - Vaccination > 1867-1929 - Report on vaccination in the Punjab > Vaccination in the Punjab 1867-1880 > 1875-1876 - Report on vaccination operations in the Punjab, during the season 1875-76
(241) Page 12
Download files
Individual page:
Thumbnail gallery: Grid view | List view

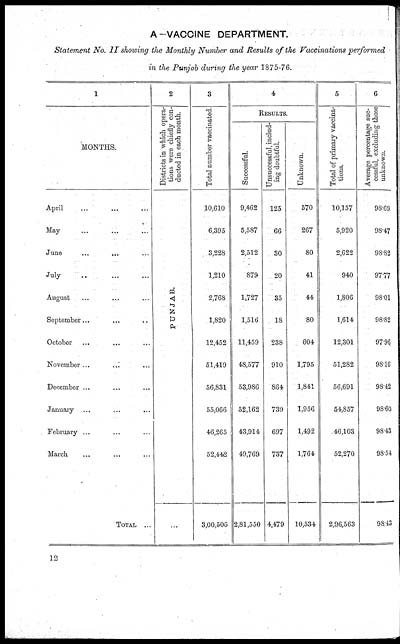
A-VACCINE DEPARTMENT.
Statement No. II showing the Monthly Number and Results of the Vaccinations performed
in the Punjab during the year 1875-76.
|
1 |
2 |
3 |
4 |
5 |
6 |
||
|
MONTHS. |
Districts in which opera- |
Total number vaccinated. |
RESULTS. |
Total of primary vaccina- |
Average percentage suc- |
||
|
Successful. |
Unsuccessful, includ- |
Unknown. |
|||||
|
April ... ... ... |
PUNJAB. |
10,610 |
9,462 |
125 |
570 |
10,157 |
98.69 |
|
May ... ... ... |
6,395 |
5,587 |
66 |
267 |
5,920 |
98.47 |
|
|
June ... ... ... |
3,228 |
2,512 |
30 |
80 |
2,622 |
98.82 |
|
|
July ... ... ... |
1,210 |
879 |
20 |
41 |
940 |
97.77 |
|
|
August ... ... ... |
2,768 |
1,727 |
35 |
44 |
1,806 |
98.01 |
|
|
September... ... ... |
1,820 |
1,516 |
18 |
80 |
1,614 |
98.82 |
|
|
October ... ... ... |
12,452 |
11,459 |
238 |
604 |
12,301 |
97.96 |
|
|
November ... ... ... |
51,419 |
48,577 |
910 |
1,795 |
51,282 |
98.16 |
|
|
December ... ... ... |
56,831 |
53,986 |
864 |
1,841 |
56,691 |
98.42 |
|
|
January ... ... ... |
55,066 |
52,162 |
739 |
1,956 |
54,857 |
98.60 |
|
|
February ... ... ... |
46,265 |
43,914 |
697 |
1,492 |
46,103 |
98.43 |
|
|
March ... ... ... |
52,442 |
49,769 |
737 |
1,764 |
52,270 |
98.54 |
|
|
TOTAL ... ... ... |
... |
3,00,506 |
2,81,550 |
4,479 |
10,534 |
2,96,563 |
98.43 |
12
Set display mode to: Large image | Zoom image | Transcription
Images and transcriptions on this page, including medium image downloads, may be used under the Creative Commons Attribution 4.0 International Licence unless otherwise stated. ![]()
| Permanent URL | https://digital.nls.uk/85748142 |
|---|
| Attribution and copyright: |
|
|---|


