Medicine - Mental health > 1930-1940 - Report on the working of the Ranchi Indian Mental Hospital, Kanke, in Bihar and Orissa > Annual report on the working of the Ranchi Indian Mental Hospital, Kanke in Bihar and Orissa for the year 1930
(17) Page 7
Download files
Individual page:
Thumbnail gallery: Grid view | List view

7
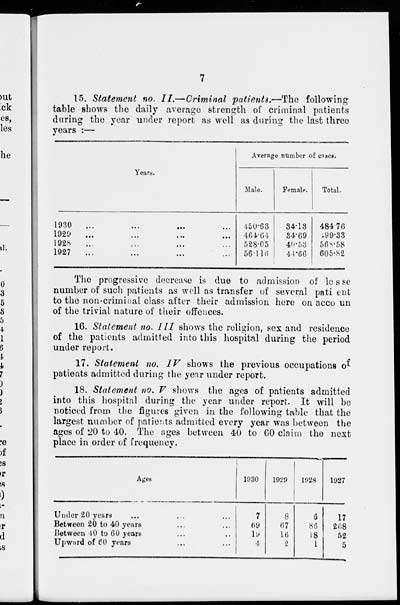
15. Statement no. II.—Criminal patients.—The following
table shows the daily average strength of criminal patients
during the year under report as well as during the last three
years :—
|
Years. |
Average number of cases. |
||
|
Male. |
Female. |
Total. |
|
|
1930 ... ... ... ... |
450.63 |
34.13 |
484.76 |
|
1929 ... ... ... ... |
464.64 |
84.69 |
499.33 |
|
1928 ... ... ... ... |
528.05 |
40.53 |
568.58 |
|
1927 ... ... ... ... |
56.116 |
44.66 |
605.82 |
The progressive decrease is due to admission of lesse
number of such patients as well as transfer of several patient
to the non-criminal class after their admission here on accoun
of the trivial nature of their offences.
16. Statement no. III shows the religion, sex and residence
of the patients admitted into this hospital during the period
under report.
17. Statement no. IV shows the previous occupations of
patients admitted during the year under report.
18. Statement no. V shows the ages of patients admitted
into this hospital during the year under report. It will be
noticed from the figures given in the following table that the
largest number of patients admitted every year was between the
ages of 20 to 40. The ages between 40 to 60 claim the next
place in order of frequency.
|
Ages |
1930 |
1929 |
1928 |
1927 |
|
Under 20 years ... ... ... |
7 |
8 |
6 |
17 |
|
Between 20 to 40 years ... ... |
69 |
67 |
86 |
208 |
|
Between 10 to 60 years ... ... |
19 |
16 |
18 |
52 |
|
Upward of 60 years ... ... |
4 |
2 |
1 |
5 |
Set display mode to: Large image | Zoom image | Transcription
Images and transcriptions on this page, including medium image downloads, may be used under the Creative Commons Attribution 4.0 International Licence unless otherwise stated. ![]()
| Permanent URL | https://digital.nls.uk/83973245 |
|---|


