

Medicine - Mental health > 1867-1924 - Annual report of the insane asylums in Bengal > Insane asylums in Bengal annual reports 1867-1875 > Annual report on the insane asylums in Bengal for the year 1872
(519) Page 7
Download files
Individual page:
Thumbnail gallery: Grid view | List view
LUNATIC ASYLUMS IN BENGAL. 7
The statistics of
the 12 months of
1872 shown sever-
ally.
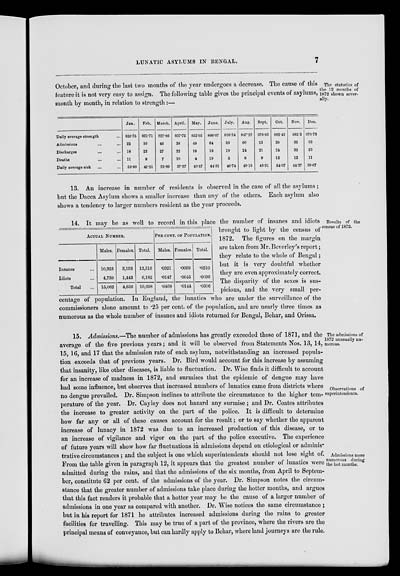
October, and during the last two months of the year undergoes a decrease. The cause of this
feature it is not very easy to assign. The following table gives the principal events of asylums,
month by month, in relation to strength:—
|
Jan. |
Feb. |
March. |
April. |
May. |
June. |
July. |
Aug. |
Sept. |
Oct. |
Nov. |
Dec. |
|
|
Daily average strength ... |
820.75 |
821.71 |
827.86 |
837.75 |
852.95 |
886.07 |
916.34 |
947.23 |
978.83 |
992.45 |
982.3 |
976.73 |
|
Admissions ... ... |
22 |
30 |
46 |
38 |
49 |
64 |
59 |
66 |
53 |
30 |
35 |
33 |
|
Discharges ... ... |
18 |
22 |
27 |
22 |
16 |
16 |
19 |
24 |
21 |
24 |
32 |
23 |
|
Deaths ... ... |
11 |
8 |
7 |
10 |
4 |
19 |
5 |
8 |
9 |
12 |
12 |
11 |
|
Daily average sick ... ... |
53.80 |
41.21 |
33.89 |
37.57 |
40.57 |
44.91 |
46.74 |
40.18 |
43.31 |
54.07 |
44.37 |
39.67 |
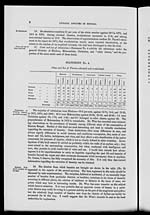
13. An increase in number of residents is observed in the case of all the asylums;
but the Dacca Asylum shows a smaller increase than any of the others. Each asylum also
shows a tendency to larger numbers resident as the year proceeds.
Results of the
census of 1872.
|
ACTUAL NUMBER. |
PER CENT. OF POPULATION. |
|||||
|
Males. |
Females. |
Total. |
Males. |
Females. |
Total. |
|
|
Insanes ... |
10,323 |
3,193 |
13,516 |
.0321 |
.0099 |
.0210 |
|
Idiots ... |
4,739 |
1,443 |
6,182 |
.0147 |
.0045 |
.0096 |
|
Total ... |
15,062 |
4,636 |
19,698 |
.0468 |
.0144 |
.0306 |
14. It may be as well to record in this place the number of insanes and idiots
brought to light by the census of
1872. The figures on the margin
are taken from Mr. Beverley's report;
they relate to the whole of Bengal;
but it is very doubtful whether
they are even approximately correct.
The disparity of the sexes is sus-
picious, and the very small per-
centage of population. In England, the lunatics who are under the surveillance of the
commissioners alone amount to .25 per cent. of the population, and are nearly three times as
numerous as the whole number of insanes and idiots returned for Bengal, Behar, and Orissa.
The admissions of
1872 unusually nu-
merous.
Observations of
superintendents.
Admissions more
numerous during
the hot months.
15. Admissions.—The number of admissions has greatly exceeded those of 1871, and the
average of the five previous years; and it will be observed from Statements Nos. 13, 14,
15, 16, and 17 that the admission rate of each asylum, notwithstanding an increased popula-
tion exceeds that of previous years. Dr. Bird would account for this increase by assuming
that insanity, like other diseases, is liable to fluctuation. Dr. Wise finds it difficult to account
for an increase of madness in 1872, and surmises that the epidemic of dengue may have
had some influence, but observes that increased numbers of lunatics came from districts where
no dengue prevailed. Dr. Simpson inclines to attribute the circumstance to the higher tem-
perature of the year. Dr. Cayley does not hazard any surmise; and Dr. Coates attributes
the increase to greater activity on the part of the police. It is difficult to determine
how far any or all of these causes account for the result; or to say whether the apparent
increase of lunacy in 1872 was due to an increased production of this disease, or to
an increase of vigilance and vigor on the part of the police executive. The experience
of future years will show how far fluctuations in admissions depend on etiological or adminis-
trative circumstances ; and the subject is one which superintendents should not lose sight of.
From the table given in paragraph 12, it appears that the greatest number of lunatics were
admitted during the rains, and that the admissions of the six months, from April to Septem-
ber, constitute 62 per cent. of the admissions of the year. Dr. Simpson notes the circum-
stance that the greater number of admissions take place during the hotter months, and argues
that this fact renders it probable that a hotter year may be the cause of a larger number of
admissions in one year as compared with another. Dr. Wise notices the same circumstance ;
but in his report for 1871 he attributes increased admissions during the rains to greater
facilities for travelling. This may be true of a part of the province, where the rivers are the
principal means of conveyance, but can hardly apply to Behar, where land journeys are the rule.
Set display mode to: Large image | Zoom image | Transcription
Images and transcriptions on this page, including medium image downloads, may be used under the Creative Commons Attribution 4.0 International Licence unless otherwise stated. ![]()
| Permanent URL | https://digital.nls.uk/83379557 |
|---|
| Description | Covers 1867-1924. Describes asylums and occurrences of disease and violence. Extensive tables show annual return of patients and causes of mental illness. Age, caste, occupation of insanes shown. Financial statements included. |
|---|---|
| Shelfmark | IP/6/HG.8 |
| Additional NLS resources: | |
| Attribution and copyright: |
|
| Description | The Mental Health collection consists of 45 volumes dating from 1867 to 1948. Reports describe lunatic asylums and mental hospitals in British India, revealing institutional conditions and care of native and European patients. Statistics show changes in classification of causes and types of insanity, and allow analysis of asylum populations. |
|---|---|
| Description | The India Papers collection contains publications of the central (Imperial) Government and many Indian states. Most states came under British rule. Much of the collection dates from between the post-Mutiny re-organisation of the Indian Government and Indian Independence in 1947. Some items published in London by John Murray. |
|---|---|
| Shelfmark | India Papers |
| Additional NLS resources: | |