

Medicine - Mental health > 1927-1951 - Annual report on the mental hospital in the Central Provinces and Berar (Nagpur) > Annual report on the mental hospital Nagpur in the Madhya Pradesh for the year 1951
(486) Page 12
Download files
Individual page:
Thumbnail gallery: Grid view | List view
|
|
||||||||||||||||||||||||||||||||||||||||||||||||||||||||||||||||||||||||||||||||||||||||||||||||||||||||||||||||||||||||||||||||||||||||||||||||||||||||||||||||||||||||||||||||||||||||||||||||||||||||||||||||||||||||||||||||||||||||||||||||||||||||||||||||||||
|
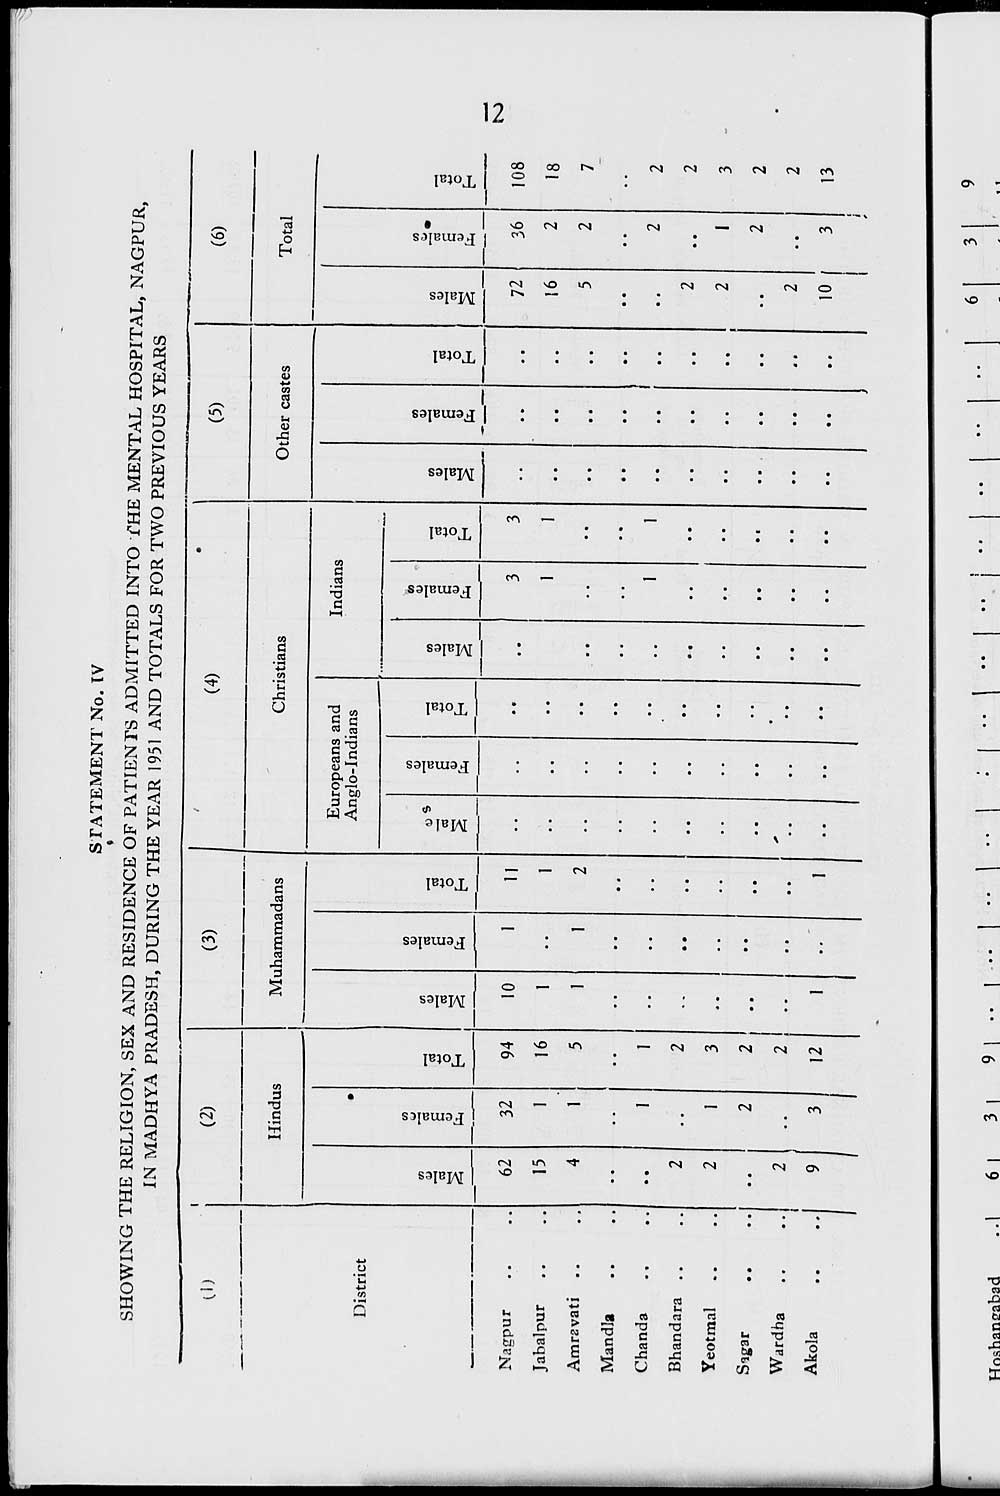
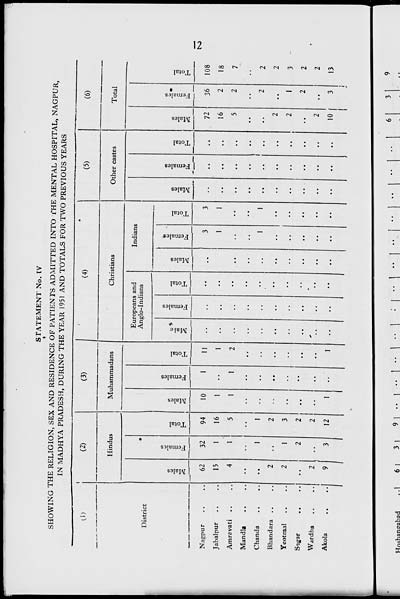
STATEMENT No. IV
t
SHOWING THE RELIGION, SEX AND RESIDENCE OF PATIENTS ADMITTED INTO THE MENTAL HOSPITAL, NAGPUR, IN MADHYA PRADESH, DURING THE YEAR 1951 AND TOTALS FOR TWO PREVIOUS YEARS
|
||||||||||||||||||||||||||||||||||||||||||||||||||||||||||||||||||||||||||||||||||||||||||||||||||||||||||||||||||||||||||||||||||||||||||||||||||||||||||||||||||||||||||||||||||||||||||||||||||||||||||||||||||||||||||||||||||||||||||||||||||||||||||||||||||||
|
|
||||||||||||||||||||||||||||||||||||||||||||||||||||||||||||||||||||||||||||||||||||||||||||||||||||||||||||||||||||||||||||||||||||||||||||||||||||||||||||||||||||||||||||||||||||||||||||||||||||||||||||||||||||||||||||||||||||||||||||||||||||||||||||||||||||
|
(5)
|
(6)
|
||||||||||||||||||||||||||||||||||||||||||||||||||||||||||||||||||||||||||||||||||||||||||||||||||||||||||||||||||||||||||||||||||||||||||||||||||||||||||||||||||||||||||||||||||||||||||||||||||||||||||||||||||||||||||||||||||||||||||||||||||||||||||||||||||
|
Other castes
|
Total
|
|||||||||||||||||||||||||||||||||||||||||||||||||||||||||||||||||||||||||||||||||||||||||||||||||||||||||||||||||||||||||||||||||||||||||||||||||||||||||||||||||||||||||||||||||||||||||||||||||||||||||||||||||||||||||||||||||||||||||||||||||||||||||||||||||||
|
CO
V
|
co
"3 �
fa
|
CO
-J
|
s
fa
|
ad
c
|
||||||||||||||||||||||||||||||||||||||||||||||||||||||||||||||||||||||||||||||||||||||||||||||||||||||||||||||||||||||||||||||||||||||||||||||||||||||||||||||||||||||||||||||||||||||||||||||||||||||||||||||||||||||||||||||||||||||||||||||||||||||||||||||||
|
o
|
cc
|
|||||||||||||||||||||||||||||||||||||||||||||||||||||||||||||||||||||||||||||||||||||||||||||||||||||||||||||||||||||||||||||||||||||||||||||||||||||||||||||||||||||||||||||||||||||||||||||||||||||||||||||||||||||||||||||||||||||||||||||||||||||||||||||||||||
|
72
16
5
|
K)
|
|||||||||||||||||||||||||||||||||||||||||||||||||||||||||||||||||||||||||||||||||||||||||||||||||||||||||||||||||||||||||||||||||||||||||||||||||||||||||||||||||||||||||||||||||||||||||||||||||||||||||||||||||||||||||||||||||||||||||||||||||||||||||||||||||||
|
36 2 2
|
108
18
7
2 2 3 2 2 13
|
|||||||||||||||||||||||||||||||||||||||||||||||||||||||||||||||||||||||||||||||||||||||||||||||||||||||||||||||||||||||||||||||||||||||||||||||||||||||||||||||||||||||||||||||||||||||||||||||||||||||||||||||||||||||||||||||||||||||||||||||||||||||||||||||||||
|
2 2
|
I
2
|
|||||||||||||||||||||||||||||||||||||||||||||||||||||||||||||||||||||||||||||||||||||||||||||||||||||||||||||||||||||||||||||||||||||||||||||||||||||||||||||||||||||||||||||||||||||||||||||||||||||||||||||||||||||||||||||||||||||||||||||||||||||||||||||||||||
|
10
|
||||||||||||||||||||||||||||||||||||||||||||||||||||||||||||||||||||||||||||||||||||||||||||||||||||||||||||||||||||||||||||||||||||||||||||||||||||||||||||||||||||||||||||||||||||||||||||||||||||||||||||||||||||||||||||||||||||||||||||||||||||||||||||||||||||
|
|
||||||||||||||||||||||||||||||||||||||||||||||||||||||||||||||||||||||||||||||||||||||||||||||||||||||||||||||||||||||||||||||||||||||||||||||||||||||||||||||||||||||||||||||||||||||||||||||||||||||||||||||||||||||||||||||||||||||||||||||||||||||||||||||||||||
|
Hoshancabad
|
1 6 I
|
|
||||||||||||||||||||||||||||||||||||||||||||||||||||||||||||||||||||||||||||||||||||||||||||||||||||||||||||||||||||||||||||||||||||||||||||||||||||||||||||||||||||||||||||||||||||||||||||||||||||||||||||||||||||||||||||||||||||||||||||||||||||||||||||||||||
|
|
||||||||||||||||||||||||||||||||||||||||||||||||||||||||||||||||||||||||||||||||||||||||||||||||||||||||||||||||||||||||||||||||||||||||||||||||||||||||||||||||||||||||||||||||||||||||||||||||||||||||||||||||||||||||||||||||||||||||||||||||||||||||||||||||||||
Set display mode to: Large image | Zoom image | Transcription
Images and transcriptions on this page, including medium image downloads, may be used under the Creative Commons Attribution 4.0 International Licence unless otherwise stated. ![]()
| Permanent URL | https://digital.nls.uk/83154059 |
|---|
| Description | Covers 1927-1951. Tables show annual return of patients and causes of mental illness. Age, caste, occupation of insanes shown. Financial statements included. |
|---|---|
| Shelfmark | IP/19/HG.5 |
| Additional NLS resources: | |
| Attribution and copyright: |
|
| Description | The Mental Health collection consists of 45 volumes dating from 1867 to 1948. Reports describe lunatic asylums and mental hospitals in British India, revealing institutional conditions and care of native and European patients. Statistics show changes in classification of causes and types of insanity, and allow analysis of asylum populations. |
|---|---|
| Description | The India Papers collection contains publications of the central (Imperial) Government and many Indian states. Most states came under British rule. Much of the collection dates from between the post-Mutiny re-organisation of the Indian Government and Indian Independence in 1947. Some items published in London by John Murray. |
|---|---|
| Shelfmark | India Papers |
| Additional NLS resources: | |