

Medicine - Mental health > 1877-1911 - Annual report on the lunatic asylums in the Madras Presidency > Lunatic asylums Madras 1877-1891 > Annual report on the lunatic asylums in the Madras Presidency for the year 1891
(645) Page 7
Download files
Individual page:
Thumbnail gallery: Grid view | List view

ANNUAL REPORT ON LUNATIC ASYLUMS. 7
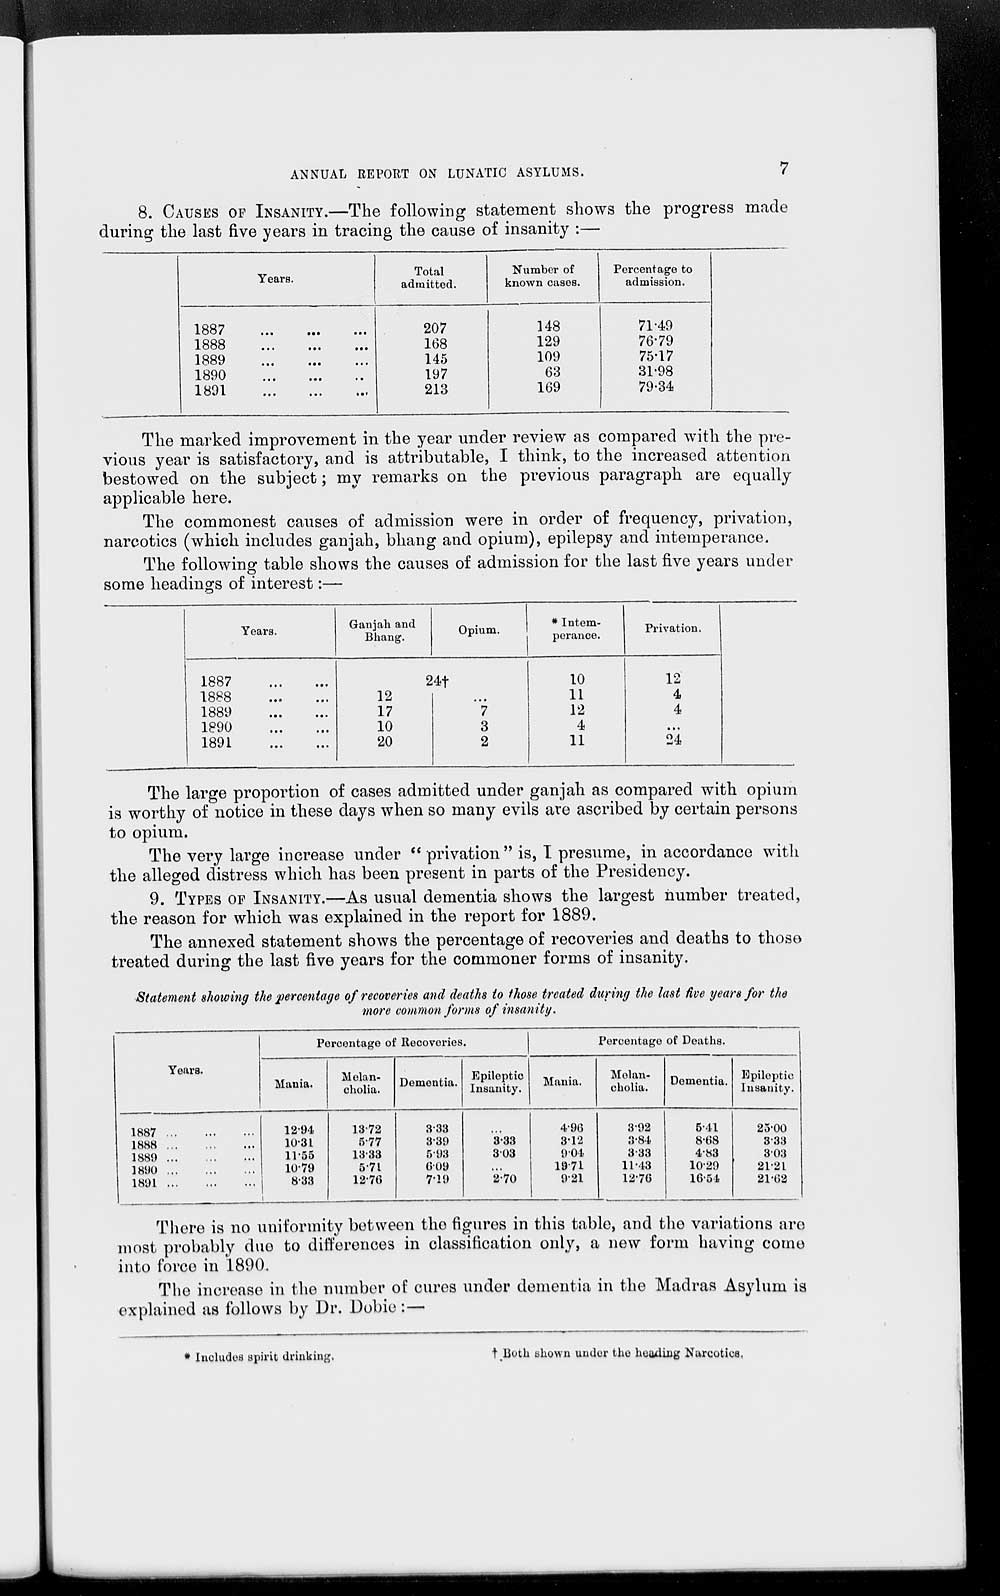
8. CAUSES OF INSANITY.—The following Statement shows the progress made
during the last five years in tracing the cause of insanity :—
|
Years. |
Total |
Number of |
Percentage to |
|
l887 ... ... ... |
207 |
148 |
71.49 |
|
1888 ... ... ... |
168 |
129 |
76.79 |
|
1889 ... ... ... |
145 |
109 |
75.17 |
|
1890 ... ... ... |
197 |
63 |
31.98 |
|
1897 ... ... ... |
213 |
169 |
79.34 |
The marked improvement in the year under review as compared with the pre-
vious year is satisfactory, and is attributable, I think, to the increased attention
bestowed on the subject; my remarks on the previous paragraph are equally
applicable here.
The commonest causes of admission were in order of frequency, privation,
narcotics (which includes ganjah, bhang and opium), epilepsy and intemperance.
The following table shows the causes of admission for the last five years under
some headings of interest:—
|
Years. |
Ganjah and |
Opium. |
* Intem- |
Privation. |
|
1887 ... ... |
24† |
10 |
12 |
|
|
1888 ... ... |
12 |
... |
11 |
4 |
|
1889 ... ... |
17 |
7 |
12 |
4 |
|
1890 ... ... |
10 |
3 |
4 |
... |
|
1891 ... ... |
20 |
2 |
11 |
24 |
The large proportion of cases admitted under ganjah as compared with opium
is worthy of notice in these days when so many evils are ascribed by certain persons
to opium.
The very large increase under " privation " is, I presume, in accordance with
the alleged distress which has been present in parts of the Presidency.
9. TYPES OF INSANITY.—As usual dementia shows the largest number treated,
the reason for which was explained in the report for 1889.
The annexed Statement shows the percentage of recoveries and deaths to those
treated during the last five years for the commoner forms of insanity.
Statement showing the percentage of recoveries and deaths to those treated during the last five years for the
more common forms of insanity.
|
Years. |
Percentage of Recoveries. |
Percentage of Deaths. |
||||||
|
Mania. |
Melan- |
Dementia. |
Epileptic |
Mania. |
Melan- |
Dementia. |
Epileptic |
|
|
1887 ... ... ... |
12.94 |
13.72 |
3.33 |
... |
4.96 |
3.92 |
5.41 |
25.00 |
|
1888 ... ... ... |
10.31 |
5.77 |
3.39 |
3.33 |
3.12 |
3.84 |
8.68 |
3.33 |
|
1889 ... ... ... |
11.55 |
13.33 |
5.93 |
3.03 |
9.04 |
3.33 |
4.83 |
3.03 |
|
1890 ... ... ... |
10.79 |
5.71 |
6.09 |
... |
19.71 |
11.43 |
10.29 |
21.21 |
|
1891 ... ... ... |
8.33 |
12.76 |
7.19 |
2.70 |
9.21 |
12.76 |
16.54 |
21.62 |
There is no uniformity between the figures in this table, and the variations are
most probably due to differences in Classification only, a new form having come
into force in 1890.
The increase in the number of cures under dementia in the Madras Asylum is
explained as follows by Dr. Dobie:—
* Includes spirit drinking. † Both shown under the heading Narcotics.
Set display mode to: Large image | Zoom image | Transcription
Images and transcriptions on this page, including medium image downloads, may be used under the Creative Commons Attribution 4.0 International Licence unless otherwise stated. ![]()
| Permanent URL | https://digital.nls.uk/82810052 |
|---|
| Description | Covers 1877-1911. Describes asylums and occurrences of disease and violence. Tables show annual return of patients and causes of mental illness. Age, caste, occupation of insanes shown. Financial statements included. Importance of cleanliness, diet and occupation on patients outlined. |
|---|---|
| Shelfmark | IP/25/HG.7 |
| Additional NLS resources: | |
| Attribution and copyright: |
|
| Description | The Mental Health collection consists of 45 volumes dating from 1867 to 1948. Reports describe lunatic asylums and mental hospitals in British India, revealing institutional conditions and care of native and European patients. Statistics show changes in classification of causes and types of insanity, and allow analysis of asylum populations. |
|---|---|
| Description | The India Papers collection contains publications of the central (Imperial) Government and many Indian states. Most states came under British rule. Much of the collection dates from between the post-Mutiny re-organisation of the Indian Government and Indian Independence in 1947. Some items published in London by John Murray. |
|---|---|
| Shelfmark | India Papers |
| Additional NLS resources: | |