

Medicine - Mental health > 1877-1911 - Annual report on the lunatic asylums in the Madras Presidency > Lunatic asylums Madras 1877-1891 > Annual report on the lunatic asylums in the Madras Presidency for the year 1890
(631) Page 31
Download files
Individual page:
Thumbnail gallery: Grid view | List view

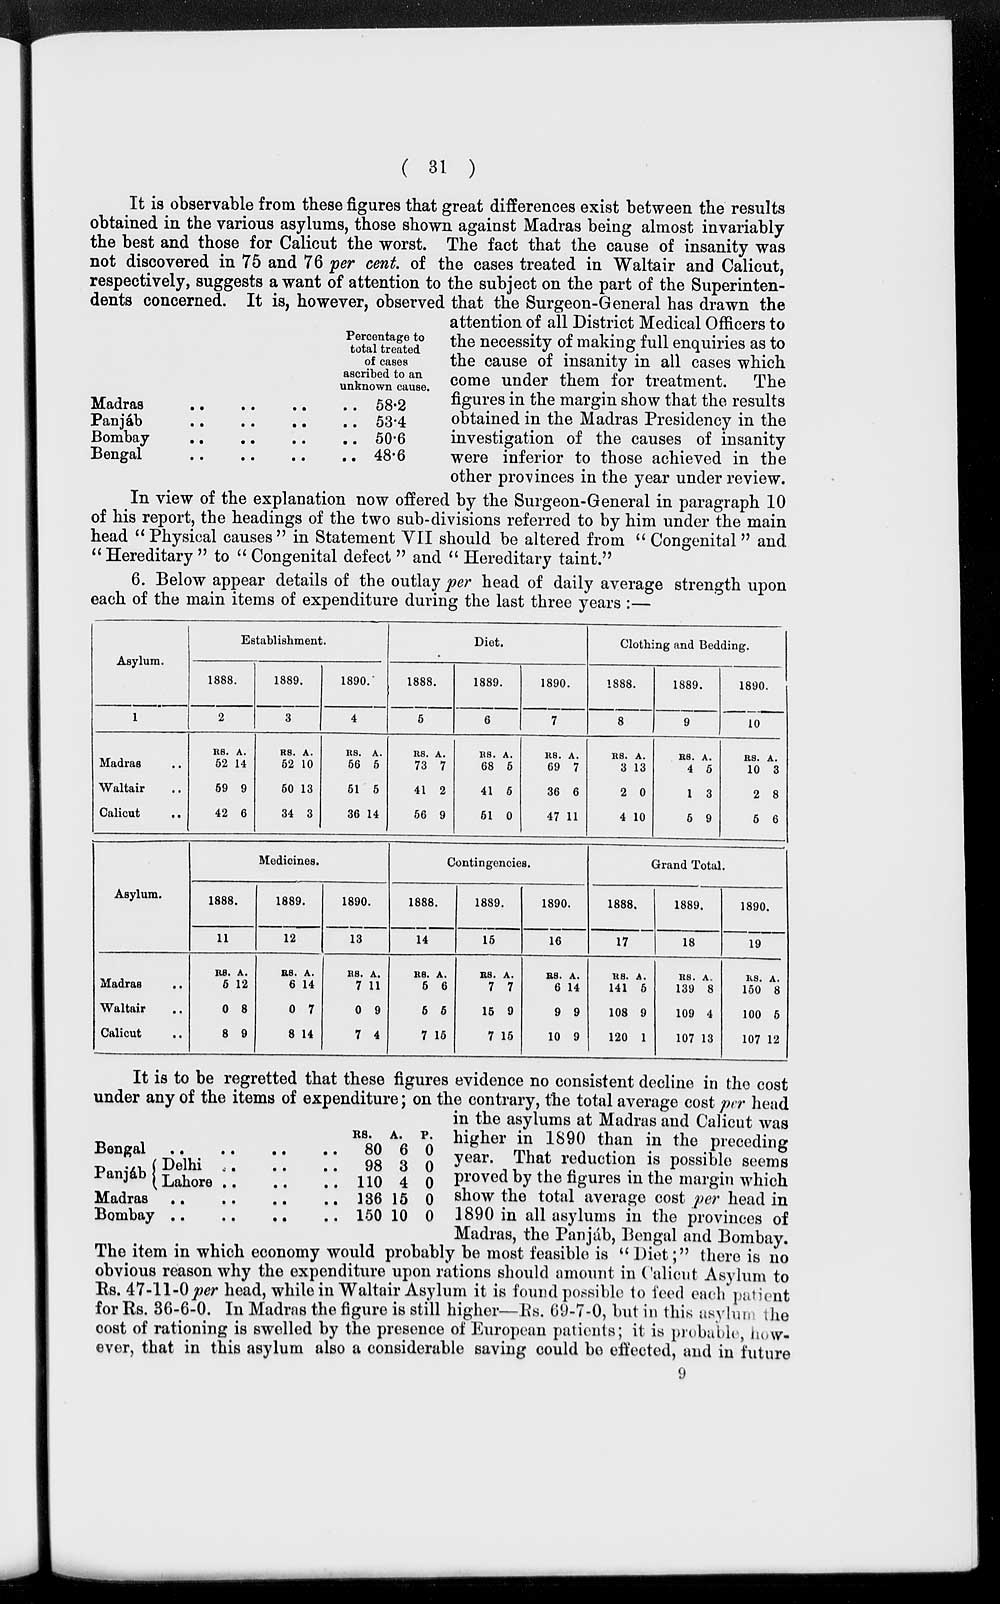
( 31 )
|
Percentage to |
|
|
Madras .. .. .. .. |
58.2 |
|
Panjáb .. .. .. .. |
53.4 |
|
Bombay .. .. .. .. |
50.6 |
|
Bengal .. .. .. .. |
48.6 |
It is observable from these figures that great differences exist between the results
obtained in the various asylums, those shown against Madras being almost invariably
the best and those for Calicut the worst. The fact that the cause of insanity was
not discovered in 75 and 76 per cent. of the cases treated in Waltair and Calicut,
respectively, suggests a want of attention to the subject on the part of the Superinten-
dents concerned. It is, however, observed that the Surgeon-General has drawn the
attention of all District Medical Officers to
the necessity of making full enquiries as to
the cause of insanity in all cases which
come under them for treatment. The
figures in the margin show that the results
obtained in the Madras Presidency in the
investigation of the causes of insanity
were inferior to those achieved in the
other provinces in the year under review.
In view of the explanation now offered by the Surgeon-General in paragraph 10
of his report, the headings of the two sub-divisions referred to by him under the main
head " Physical causes " in Statement VII should be altered from " Congenital" and
"Hereditary " to " Congenital defect " and " Hereditary taint."
6. Below appear details of the outlay per head of daily average strength upon
each of the main items of expenditure during the last three years :—
|
Asylum. |
Establishment. |
Diet. |
Clothing and Bedding. |
|||||||||||||||
|
1888. |
1889. |
1890. |
1888. |
1889. |
1890. |
1888. |
1889. |
1890. |
||||||||||
|
1 |
2 |
3 |
4 |
5 |
6 |
7 |
8 |
9 |
10 |
|||||||||
|
RS. |
A. |
RS. |
A. |
RS. |
A. |
RS. |
A. |
RS. |
A. |
RS. |
A. |
RS. |
A. |
RS. |
A. |
RS. |
A. |
|
|
Madras .. |
52 |
14 |
52 |
10 |
56 |
5 |
73 |
7 |
68 |
5 |
69 |
7 |
3 |
13 |
4 |
5 |
10 |
3 |
|
Waltair .. |
59 |
9 |
50 |
13 |
51 |
6 |
41 |
2 |
41 |
5 |
36 |
6 |
2 |
0 |
1 |
3 |
2 |
8 |
|
Calicut .. |
42 |
6 |
34 |
3 |
36 |
14 |
56 |
9 |
51 |
0 |
47 |
11 |
4 |
10 |
5 |
9 |
5 |
6 |
|
Asylum. |
Medicines. |
Contingencies. |
Grand Total. |
|||||||||||||||
|
1888. |
1889. |
1890. |
1888. |
1889. |
1890. |
1888. |
1889. |
1890. |
||||||||||
|
11 |
12 |
13 |
14 |
15 |
16 |
17 |
18 |
19 |
||||||||||
|
Rs. |
A. |
Rs. |
A. |
Rs. |
A. |
Rs. |
A. |
Rs. |
A. |
Rs. |
A. |
Rs. |
A. |
Rs. |
A. |
Rs. |
A. |
|
|
Madras .. |
5 |
12 |
6 |
14 |
7 |
11 |
5 |
6 |
7 |
7 |
6 |
14 |
141 |
5 |
139 |
8 |
150 |
8 |
|
Waltair .. |
0 |
8 |
0 |
7 |
0 |
9 |
5 |
5 |
15 |
9 |
9 |
9 |
108 |
9 |
109 |
4 |
100 |
5 |
|
Calicut .. |
8 |
9 |
8 |
14 |
7 |
4 |
7 |
15 |
7 |
15 |
10 |
9 |
120 |
1 |
107 |
13 |
107 |
12 |
|
Rs. |
A. |
P. |
||
|
Bengal .. .. .. .. |
80 |
6 |
0 |
|
|
Panjáb |
Delhi .. .. .. |
98 |
3 |
0 |
|
Lahore .. .. .. |
110 |
4 |
0 |
|
|
Madras .. .. .. .. |
136 |
15 |
0 |
|
|
Bombay .. .. .. .. |
150 |
10 |
0 |
|
It is to be regretted that these figures evidence no consistent decline in the cost
under any of the items of expenditure; on the contrary, the total average cost per head
in the asylums at Madras and Calicut was
higher in 1890 than in the preceding
year. That reduction is possible seems
proved by the figures in the margin which
show the total average cost per head in
1890 in all asylums in the provinces of
Madras, the Panjáb, Bengal and Bombay.
The item in which economy would probably be most feasible is " Diet;" there is no
obvious reason why the expenditure upon rations should amount in Calicut Asylum to
Rs. 47-11-0 per head, while in Waltair Asylum it is found possible to feed each patient
for Rs. 36-6-0. In Madras the figure is still higher—Rs. 69-7-0, but in this asylum the
cost of rationing is swelled by the presence of European patients; it is probable, how-
ever, that in this asylum also a considerable saving could be effected, and in future
9
Set display mode to: Large image | Zoom image | Transcription
Images and transcriptions on this page, including medium image downloads, may be used under the Creative Commons Attribution 4.0 International Licence unless otherwise stated. ![]()
| Permanent URL | https://digital.nls.uk/82810010 |
|---|
| Description | Covers 1877-1911. Describes asylums and occurrences of disease and violence. Tables show annual return of patients and causes of mental illness. Age, caste, occupation of insanes shown. Financial statements included. Importance of cleanliness, diet and occupation on patients outlined. |
|---|---|
| Shelfmark | IP/25/HG.7 |
| Additional NLS resources: | |
| Attribution and copyright: |
|
| Description | The Mental Health collection consists of 45 volumes dating from 1867 to 1948. Reports describe lunatic asylums and mental hospitals in British India, revealing institutional conditions and care of native and European patients. Statistics show changes in classification of causes and types of insanity, and allow analysis of asylum populations. |
|---|---|
| Description | The India Papers collection contains publications of the central (Imperial) Government and many Indian states. Most states came under British rule. Much of the collection dates from between the post-Mutiny re-organisation of the Indian Government and Indian Independence in 1947. Some items published in London by John Murray. |
|---|---|
| Shelfmark | India Papers |
| Additional NLS resources: | |