

Medicine - Mental health > 1877-1911 - Annual report on the lunatic asylums in the Madras Presidency > Lunatic asylums Madras 1877-1891 > Annual report on the lunatic asylums in the Madras Presidency for the year 1889
(593) Page 27
Download files
Individual page:
Thumbnail gallery: Grid view | List view
( 27 )
GOVERNMENT OF MADRAS.
JUDICIAL DEPARTMENT.
READ—the following paper :—
From the Surgeon-General with the Government of Madras, dated Fort St.
George, 9th September 1890, No. 686.
ABSTRACT.—Submitting the annual report and statistics showing the working of the Lunatic
Asylums in the Presidency for 1889.
ORDER—dated 19th December 1890, No. 2067, Judicial.
The report on the administration of Lunatic Asylums during 1889 discloses no
facts of particular importance and calls for but few remarks.
2. A prominent feature of the report for 1888 was the decline in admissions, and
in its review the Government observed that this decrease must be ascribed solely to
the want of accommodation; the same circumstance was again noticeable in 1889 and
was no doubt due to the same cause. This matter will be referred to again in con-
nection with criminal lunatics.
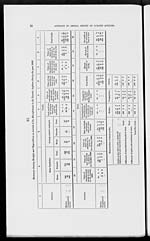
3. Statistics in regard to the lunatic population under treatment in the asylums
appear in the following statement:—
|
Population remaining on |
Admitted. |
Total population. |
Discharged. |
Died. |
Remaining. |
||||||
|
1888. |
1889. |
1888. |
1889. |
1888. |
1889. |
1888. |
1889. |
1888. |
1889. |
1888. |
1889. |
|
627 |
647 |
168 |
145 |
795 |
792 |
109 |
109 |
39 |
51 |
647 |
632 |
The next table contains particulars of the results obtained in the three asylums
viewed as curative institutions:—
|
Asylum. |
Percentage to daily average strength. |
Percentage to admissions. |
||||||||||
|
Cured. |
Died. |
Cured. |
Died. |
|||||||||
|
1889. |
1888. |
Last 10 |
1889. |
1888. |
Last 10 |
1889. |
1888. |
Last 10 |
1889. |
1888. |
Last 10 |
|
|
Madras .. .. |
13.68 |
8.10 |
14.69 |
9.49 |
7.03 |
7.30 |
54.38 |
29.92 |
38.93 |
37.71 |
25.98 |
20.12 |
|
Vizagapatam .. |
3.57 |
5.62 |
16.79 |
0.00 |
1.87 |
11.14 |
40.00 |
33.33 |
54.83 |
0.00 |
11.11 |
29.27 |
|
Calicut .. .. |
2.98 |
16.30 |
17.76 |
5.95 |
4.07 |
6.56 |
15.38 |
62.50 |
55.42 |
30.77 |
15.63 |
17.12 |
|
Total .. |
10.57 |
9.45 |
15.43 |
7.92 |
6.04 |
7.53 |
46.89 |
36.30 |
42.05 |
35.17 |
23.31 |
20.73 |
On the whole, these results are not entirely satisfactory, for, although the propor-
tion of cures was higher than in the preceding year, it was lower than the average of
the decade; the death-rate was also unusually high. But in spite of the fact that
1889 contrasted unfavorably with the preceding years, a comparison with the results
8
Set display mode to: Large image | Zoom image | Transcription
Images and transcriptions on this page, including medium image downloads, may be used under the Creative Commons Attribution 4.0 International Licence unless otherwise stated. ![]()
| Permanent URL | https://digital.nls.uk/82809896 |
|---|
| Description | Covers 1877-1911. Describes asylums and occurrences of disease and violence. Tables show annual return of patients and causes of mental illness. Age, caste, occupation of insanes shown. Financial statements included. Importance of cleanliness, diet and occupation on patients outlined. |
|---|---|
| Shelfmark | IP/25/HG.7 |
| Additional NLS resources: | |
| Attribution and copyright: |
|
| Description | The Mental Health collection consists of 45 volumes dating from 1867 to 1948. Reports describe lunatic asylums and mental hospitals in British India, revealing institutional conditions and care of native and European patients. Statistics show changes in classification of causes and types of insanity, and allow analysis of asylum populations. |
|---|---|
| Description | The India Papers collection contains publications of the central (Imperial) Government and many Indian states. Most states came under British rule. Much of the collection dates from between the post-Mutiny re-organisation of the Indian Government and Indian Independence in 1947. Some items published in London by John Murray. |
|---|---|
| Shelfmark | India Papers |
| Additional NLS resources: | |