

Medicine - Mental health > 1877-1911 - Annual report on the lunatic asylums in the Madras Presidency > Lunatic asylums Madras 1877-1891 > Annual report on the lunatic asylums in the Madras Presidency during the year 1882-83
(274) Page 4
![[Page 3]](https://deriv.nls.uk/dcn4/8280/82808880.4.jpg)
Download files
Individual page:
Thumbnail gallery: Grid view | List view

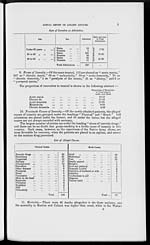
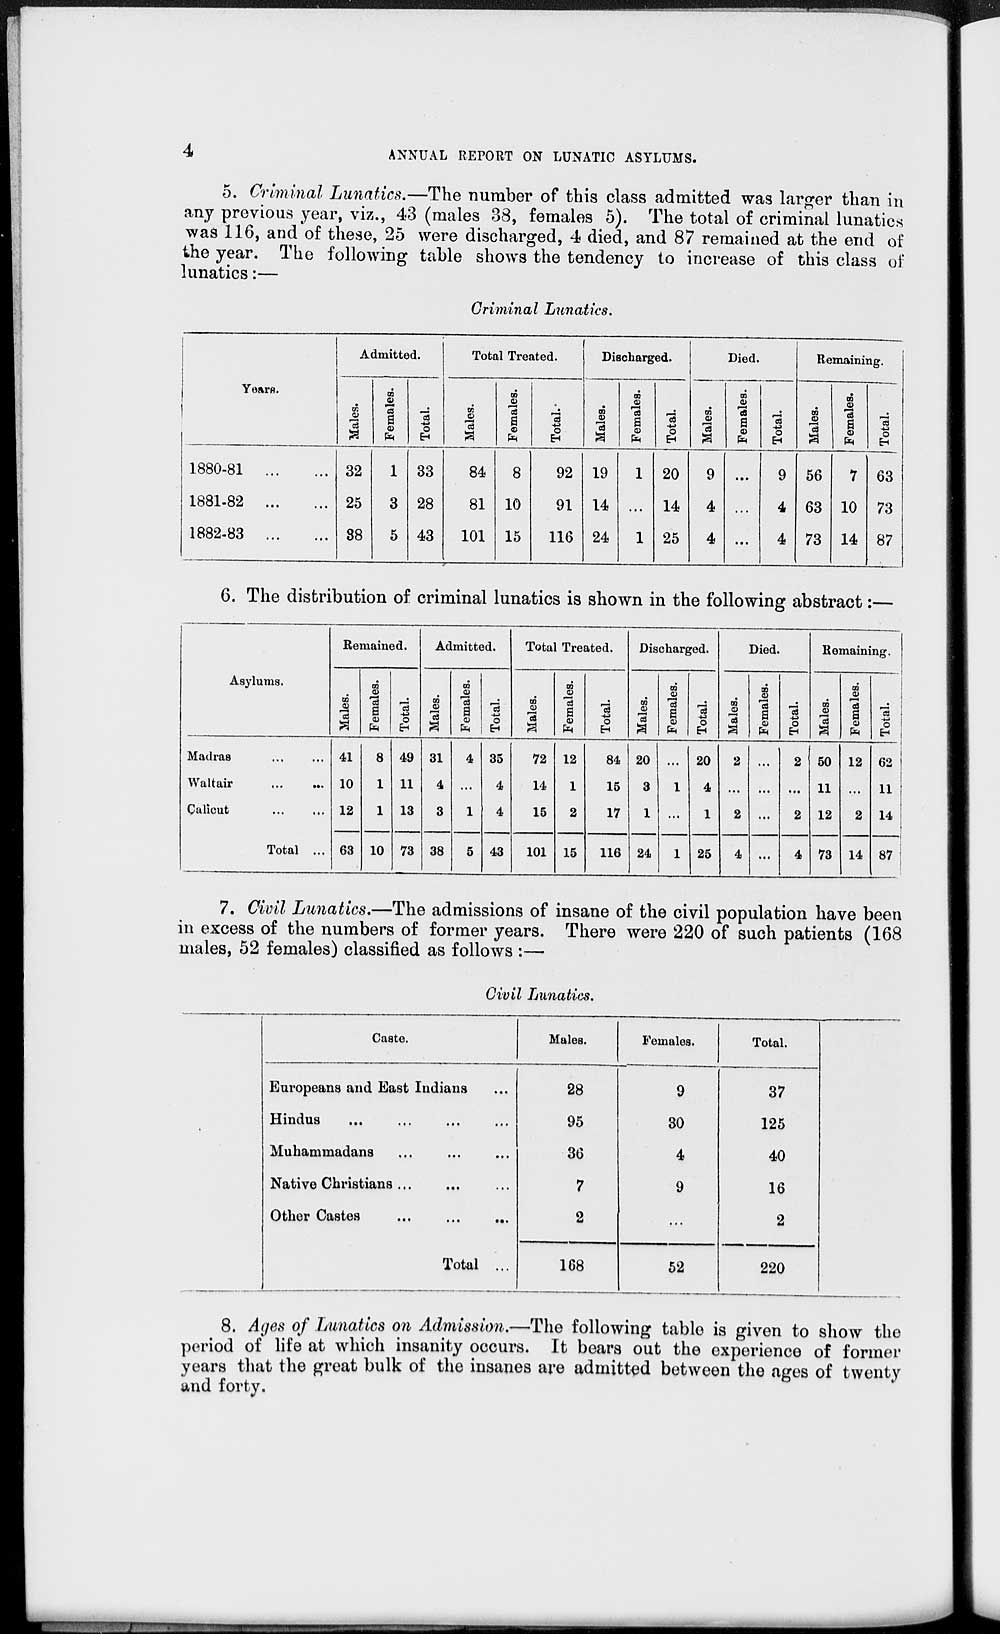
4 ANNUAL REPORT ON LUNATIC ASYLUMS.
5. Criminal Lunatics.—The number of this class admitted was larger than in
any previous year, viz., 43 (males 38, females 5). The total of criminal lunatics
was 116, and of these, 25 were discharged, 4 died, and 87 remained at the end of
the year. The following table shows the tendency to increase of this class of
lunatics:—
Criminal Lunatics.
|
Admitted. |
Total Treated. |
Discharged. |
Died. |
Remaining. |
|||||||||||
|
Years. |
Males. |
Females. |
Total. |
Males. |
Females. |
Total. |
Males. |
Females. |
Total. |
Males. |
Females. |
Total. |
Males. |
Females. |
Total. |
|
1880-81 ... ... |
32 |
1 |
33 |
84 |
8 |
92 |
19 |
1 |
20 |
9 |
... |
9 |
56 |
7 |
63 |
|
1881-82 ... ... |
25 |
3 |
28 |
81 |
10 |
91 |
14 |
... |
14 |
4 |
... |
4 |
63 |
10 |
73 |
|
1882-83 ... ... |
88 |
5 |
43 |
101 |
15 |
116 |
24 |
1 |
25 |
4 |
... |
4 |
73 |
14 |
87 |
6. The distribution of criminal lunatics is shown in the following abstract:—
|
Asylums. |
Remained. |
Admitted. |
Total Treated. |
Discharged. |
Died. |
Remaining. |
||||||||||||
|
Males. |
Females. |
Total. |
Males. |
Females. |
Total. |
Males. |
Females. |
Total. |
Males. |
Females. |
Total. |
Males. |
Females. |
Total. |
Males. |
Females. |
Total. |
|
|
Madras ... ... |
41 |
8 |
49 |
31 |
4 |
35 |
72 |
12 |
84 |
20 |
... |
20 |
2 |
... |
2 |
50 |
12 |
62 |
|
Waltair ... ... |
10 |
1 |
11 |
4 |
... |
4 |
14 |
1 |
15 |
3 |
1 |
4 |
... |
... |
... |
11 |
... |
11 |
|
Calicut ... ... |
12 |
1 |
13 |
3 |
1 |
4 |
15 |
2 |
17 |
1 |
... |
1 |
2 |
... |
2 |
12 |
2 |
14 |
|
Total ... |
63 |
10 |
73 |
38 |
5 |
43 |
101 |
15 |
116 |
24 |
1 |
25 |
4 |
... |
4 |
73 |
14 |
87 |
7. Civil Lunatics.—The admissions of insane of the civil population have been
in excess of the numbers of former years. There were 220 of such patients (168
males, 52 females) classified as follows :—
Civil Lunatics.
|
Caste. |
Males. |
Females. |
Total. |
||
|
Europeans and East Indians ... |
28 |
9 |
37 |
||
|
Hindus ... ... ... ... |
95 |
30 |
125 |
||
|
Mubammadans ... ... ... |
36 |
4 |
40 |
||
|
Native Christians ... ... ... |
7 |
9 |
16 |
||
|
Other Castes ... ... ... |
2 |
... |
2 |
||
|
Total ... |
168 |
52 |
220 |
8. Ages of Lunatics on Admission.—The following table is given to show the
period of life at which insanity occurs. It bears out the experience of former
years that the great bulk of the insanes are admitted between the ages of twenty
and forty.
Set display mode to: Large image | Zoom image | Transcription
Images and transcriptions on this page, including medium image downloads, may be used under the Creative Commons Attribution 4.0 International Licence unless otherwise stated. ![]()
| Permanent URL | https://digital.nls.uk/82808881 |
|---|
| Description | Covers 1877-1911. Describes asylums and occurrences of disease and violence. Tables show annual return of patients and causes of mental illness. Age, caste, occupation of insanes shown. Financial statements included. Importance of cleanliness, diet and occupation on patients outlined. |
|---|---|
| Shelfmark | IP/25/HG.7 |
| Additional NLS resources: | |
| Attribution and copyright: |
|
| Description | The Mental Health collection consists of 45 volumes dating from 1867 to 1948. Reports describe lunatic asylums and mental hospitals in British India, revealing institutional conditions and care of native and European patients. Statistics show changes in classification of causes and types of insanity, and allow analysis of asylum populations. |
|---|---|
| Description | The India Papers collection contains publications of the central (Imperial) Government and many Indian states. Most states came under British rule. Much of the collection dates from between the post-Mutiny re-organisation of the Indian Government and Indian Independence in 1947. Some items published in London by John Murray. |
|---|---|
| Shelfmark | India Papers |
| Additional NLS resources: | |