Medicine - Veterinary > Civil Veterinary Departments > 1936-1950 - Annual report of the Civil Veterinary Department, Bihar > 1940-1950 - Civil Veterinary Department Bihar reports 1940-50 > 1940-1941 - Annual report of the Civil Veterinary Department Bihar for the year 1940-41
(44) Page ii
Download files
Individual page:
Thumbnail gallery: Grid view | List view

ii
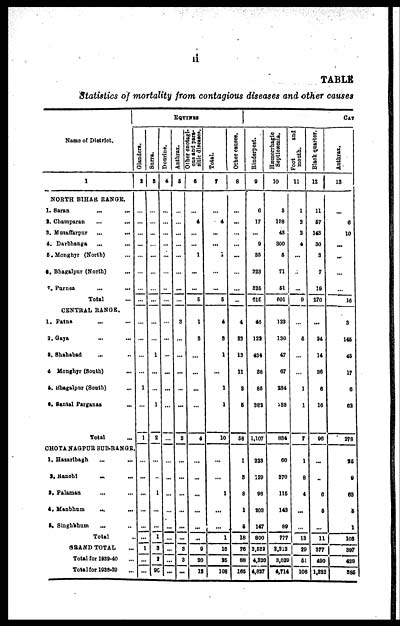
TABLE
Statistics of mortality from contagious diseases and other causes
|
Name of District. |
EQUINES |
CAT |
||||||||||
|
Glanders. |
Surra. |
Dourine. |
Anthrax. |
ous and para- |
Total. |
Other causes. |
Rinderpest. |
Hæmorrhagie |
Foot and |
Black quarter. |
Anthrax. |
|
|
1 |
2 |
3 |
4 |
5 |
6 |
7 |
8 |
9 |
10 |
11 |
12 |
13 |
|
NORTH BIHAR RANGE. |
||||||||||||
|
1. Saran ... ... |
… |
… |
… |
… |
… |
… |
... |
6 |
3 |
1 |
11 |
... |
|
2. Champaran ... ... |
... |
… |
… |
… |
4 |
4 |
... |
17 |
198 |
2 |
67 |
6 |
|
3. Muzaffarpur ... ... |
... |
… |
… |
... |
... |
... |
... |
... |
43 |
2 |
143 |
10 |
|
4. Darbhanga ... ... |
… |
… |
… |
... |
... |
... |
... |
9 |
300 |
4 |
30 |
... |
|
5.Monghjr (North) ... |
… |
… |
... |
… |
1 |
1 |
... |
86 |
6 |
... |
3 |
... |
|
6. Bhagalpur (North) ... |
… |
… |
… |
… |
... |
... |
… |
223 |
71 |
… |
7 |
... |
|
7. Purnea ... ... |
… |
… |
… |
… |
… |
… |
... |
325 |
61 |
… |
19 |
… |
|
Total … |
… |
… |
… |
… |
6 |
5 |
… |
515 |
601 |
9 |
270 |
16 |
|
CENTRAL RANGE. |
||||||||||||
|
1. Patna ... ... |
… |
… |
… |
3 |
1 |
4 |
4 |
40 |
123 |
… |
... |
3 |
|
2. Gaya ... ... |
… |
… |
… |
… |
3 |
8 |
22 |
122 |
130 |
6 |
24 |
146 |
|
3. Shahabad ... ... |
… |
1 |
... |
... |
... |
1 |
13 |
434 |
47 |
… |
14 |
46 |
|
4 Monghyr (South) ... |
... |
... |
... |
... |
... |
... |
11 |
88 |
67 |
… |
36 |
17 |
|
5. Bhagalpor (South) ... |
1 |
... |
... |
... |
... |
1 |
8 |
86 |
234 |
1 |
6 |
6 |
|
6. Santal Parganas ... |
… |
1 |
... |
... |
… |
1 |
6 |
382 |
283 |
1 |
16 |
62 |
|
Total … |
1 |
2 |
… |
3 |
4 |
10 |
68 |
1,107 |
834 |
7 |
96 |
278 |
|
CHOTA NAGPUR SUB-RANGE. |
||||||||||||
|
1. Hazaribagh ... ... |
… |
… |
… |
... |
... |
... |
1 |
223 |
60 |
1 |
... |
36 |
|
2. Ranchi ... ... |
... |
.. |
… |
... |
... |
... |
8 |
129 |
370 |
8 |
.. |
9 |
|
3. Palaman ... ... |
... |
1 |
... |
… |
... |
1 |
8 |
98 |
116 |
4 |
6 |
68 |
|
4. Manbhum ... ... |
... |
... |
... |
... |
... |
... |
1 |
203 |
143 |
... |
6 |
6 |
|
5. Singhbhum ... ... |
... |
... |
... |
... |
... |
... |
5 |
147 |
89 |
… |
... |
1 |
|
Total … |
... |
1 |
... |
... |
... |
1 |
18 |
800 |
777 |
13 |
11 |
108 |
|
GRAND TOTAL ... |
1 |
8 |
... |
3 |
9 |
16 |
76 |
2,521 |
2,212 |
29 |
377 |
897 |
|
Total for 1939-40 ... |
… |
2 |
... |
3 |
20 |
25 |
88 |
4,320 |
3,020 |
61 |
490 |
428 |
|
Total for 1938-39 ... |
... |
96 |
... |
... |
12 |
108 |
165 |
4,827 |
4,714 |
106 |
1,328 |
886 |
Set display mode to: Large image | Zoom image | Transcription
Images and transcriptions on this page, including medium image downloads, may be used under the Creative Commons Attribution 4.0 International Licence unless otherwise stated. ![]()
| Permanent URL | https://digital.nls.uk/75755601 |
|---|


