Medicine - Veterinary > Civil Veterinary Departments > 1907-1911 - Report on the Civil Veterinary Department, Eastern Bengal and Assam > Report of the Civil Veterinary Department, Eastern Bengal and Assam, for the year 1907-1908
(46) Page 10
Download files
Individual page:
Thumbnail gallery: Grid view | List view

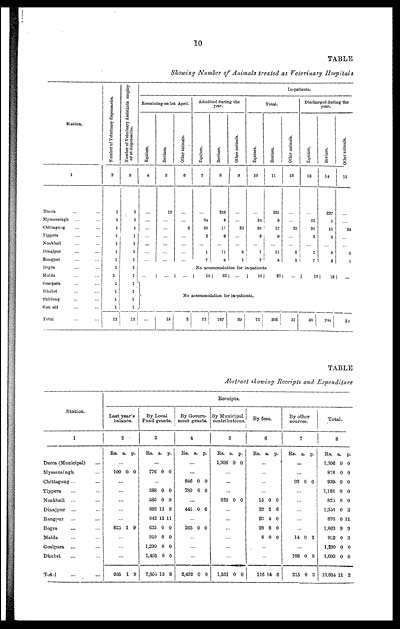
10
TABLE
Showing Number of Animals treated at Veterinary Hospitals
|
Station. |
Number of Veterinary dispensaries. |
Number of Veterinary Assistants employ- |
In-patients. |
|||||||||||
|
Remaining on 1st April. |
Admitted during the |
Total. |
Discharged during the |
|||||||||||
|
Equines. |
Bovines. |
Other animals. |
Equines. |
Bovines. |
Other animals. |
Equines. |
Bovines. |
Other animals. |
Equines. |
Bovines. |
Other animals. |
|||
|
1 |
2 |
3 |
4 |
5 |
6 |
7 |
8 |
9 |
10 |
11 |
12 |
13 |
14 |
15 |
|
Dacca ... ... |
1 |
1 |
... |
15 |
... |
... |
216 |
... |
... |
231 |
... |
... |
227 |
... |
|
Mymensingh ... ... |
1 |
1 |
... |
... |
... |
24 |
8 |
... |
24 |
8 |
... |
22 |
7 |
... |
|
Chittagong ... ... |
1 |
1 |
... |
... |
2 |
28 |
17 |
23 |
23 |
17 |
25 |
26 |
15 |
24 |
|
Tippera ... ... |
1 |
1 |
... |
... |
... |
2 |
9 |
... |
2 |
9 |
... |
2 |
9 |
... |
|
Noakhali ... ... |
1 |
1 |
... |
... |
... |
... |
... |
... |
... |
... |
... |
... |
... |
... |
|
Dinajpur ... ... |
1 |
1 |
... |
... |
... |
1 |
11 |
5 |
1 |
11 |
5 |
1 |
6 |
5 |
|
Rangpur ... ... |
1 |
1 |
... |
... |
... |
7 |
4 |
1 |
7 |
4 |
1 |
7 |
2 |
1 |
|
Bogra ... ... |
1 |
1 |
... |
... |
... |
No accommodation for in-patients |
||||||||
|
Malda ... ... |
1 |
1 |
... |
... |
... |
10 |
22 |
... |
10 |
| 22 |
... |
10 |
18 |
... |
|
Goalpara ... ... |
1 |
1 |
No accommodation for in-patients. |
|||||||||||
|
Dhubri ... ... |
1 |
1 |
||||||||||||
|
Shillong .. ... |
1 |
1 |
||||||||||||
|
Gaurati ... ... |
1 |
1 |
||||||||||||
|
Total ... ... |
13 |
13 |
... |
15 |
2 |
72 |
287 |
29 |
72 |
302 |
31 |
68 |
284 |
30 |
TABLE
Abstract showing Receipts and Expenditure
|
Station. |
Receipts. |
||||||||||||||||||||
|
Last year's |
By Local |
By Govern- |
By Municipal |
By fees. |
By other |
Total. |
|||||||||||||||
|
1 |
2 |
3 |
4 |
5 |
6 |
7 |
8 |
||||||||||||||
|
Rs. |
a. |
p. |
Rs. |
a. |
p. |
Rs. |
a. |
p. |
Rs. |
a. |
p. |
Rs. |
a. |
p. |
Rs. |
a. |
p. |
Rs. |
a. |
p. |
|
|
Dacca (Municipal) ... |
... |
... |
... |
1,306 |
0 |
0 |
... |
... |
1,306 |
0 |
0 |
||||||||||
|
Mymensingh ... |
100 |
0 |
0 |
776 |
0 |
0 |
... |
... |
... |
... |
876 |
0 |
0 |
||||||||
|
Chittagong ... ... |
... |
... |
846 |
0 |
0 |
... |
... |
93 |
0 |
0 |
939 |
0 |
0 |
||||||||
|
Tippera ... ... |
... |
388 |
0 |
0 |
780 |
0 |
0 |
... |
... |
... |
1,168 |
0 |
0 |
||||||||
|
Noakhali ... ... |
... |
585 |
0 |
0 |
... |
225 |
0 |
0 |
15 |
0 |
0 |
... |
823 |
0 |
0 |
||||||
|
Dinajpur ... ... |
... |
882 |
13 |
9 |
441 |
0 |
6 |
... |
32 |
2 |
6 |
... |
1,356 |
0 |
3 |
||||||
|
Rangnur ... ... |
... |
842 |
12 |
11 |
... |
... |
33 |
4 |
0 |
... |
876 |
0 |
11 |
||||||||
|
Bogra ... ... |
835 |
1 |
9 |
635 |
0 |
0 |
365 |
0 |
0 |
... |
28 |
8 |
0 |
... |
1,863 |
9 |
9 |
||||
|
Malda ... ... |
... |
910 |
0 |
0 |
... |
... |
8 |
0 |
0 |
14 |
0 |
3 |
902 |
0 |
3 |
||||||
|
Goalpara ... ... |
... |
1,290 |
0 |
0 |
... |
... |
... |
... |
1,290 |
0 |
0 |
||||||||||
|
Dhubri ... ... |
... |
1,495 |
0 |
0 |
... |
... |
... |
108 |
0 |
0 |
1,603 |
0 |
0 |
||||||||
|
Total ... ... |
935 |
1 |
9 |
7,804 |
10 |
8 |
2,432 |
0 |
0 |
1,531 |
0 |
0 |
116 |
14 |
6 |
215 |
0 |
3 |
13,034 |
11 |
2 |
Set display mode to: Large image | Zoom image | Transcription
Images and transcriptions on this page, including medium image downloads, may be used under the Creative Commons Attribution 4.0 International Licence unless otherwise stated. ![]()
| Permanent URL | https://digital.nls.uk/75721816 |
|---|


