Medicine - Veterinary > Civil Veterinary Departments > 1910-1933 - Annual administration report of the Civil Veterinary Department, Madras Presidency > 1910-1925 - Civil Veterinary Department. Madras. Admin. report 1910-25 > 1912-1913 - Annual administration report of the Civil Veterinary Department, Madras Presidency for 1912-13
(70) Page 10
Download files
Individual page:
Thumbnail gallery: Grid view | List view

10
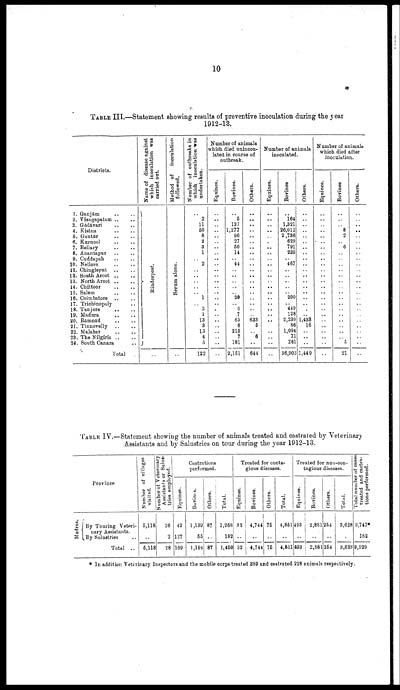
TABLE III.—Statement showing results of preventive inoculation during the year
1912-13.
|
Districts. |
Name of disease against |
Method of inoculation |
Number of outbreaks in |
Number of animals |
Number of animals |
Number of animals whioh died after inoculation. |
||||||
|
Equines. |
Bovines. |
Others. |
Equines. |
Bovines |
Others. |
Equines. |
Bovines |
Others. |
||||
|
1. Ganjam .. |
Rinderpest. |
Serum alone. |
.. |
.. |
.. |
.. |
.. |
|||||
|
2. Vizagapatam |
2 |
.. |
5 |
.. |
.. |
164 |
.. |
„ |
||||
|
3. Godavari |
11 |
.. |
137 |
.. |
.. |
1,321 |
.. |
|||||
|
4. Kistna |
50 |
.. |
1,277 |
.. |
.. |
26,012 |
.. |
8 |
||||
|
6. Guntur |
8 |
.. |
90 |
.. |
.. |
2,736 |
.. |
2 |
||||
|
6. Kurnool |
2 |
.. |
27 |
.. |
.. |
629 |
||||||
|
7. Bellary |
3 |
.. |
50 |
.. |
.. |
791 |
„ |
6 |
||||
|
8. Anantapar |
1 |
.. |
14 |
.. |
.. |
235 |
.. |
|||||
|
9. Cuddapah |
.. |
.. |
.. |
.. |
.. |
.. |
||||||
|
10. Nellore |
2 |
.. |
44 |
.. |
.. |
467 |
.. |
|||||
|
11. Chingleput |
.. |
.. |
.. |
.. |
.. |
.. |
.. |
|||||
|
12. South Arcot „. |
.. |
.. |
.. |
.. |
.. |
„ |
„ |
|||||
|
13. North Arcot .. |
.. |
.. |
.. |
.. |
.. |
.. |
.. |
|||||
|
14. Chittoor ..... |
.. |
.. |
.. |
.. |
.. |
„ |
||||||
|
15. Salem |
.. |
.. |
.. |
.. |
.. |
.. |
.. |
.. |
||||
|
16. Coimbatore |
1 |
.. |
20 |
.. |
.. |
200 |
.. |
.. |
||||
|
17. Trichinopoly |
.. |
.. |
.. |
.. |
.. |
.. |
||||||
|
18. Tanjore |
3 |
.. |
6 |
.. |
.. |
449 |
||||||
|
19. Madura |
1 |
.. |
7 |
.. |
.. |
128 |
.. |
|||||
|
20. Rāmnād |
13 |
.. |
65 |
633 |
.. |
2,239 |
1,433 |
|||||
|
21. Tinnevelly |
3 |
.. |
6 |
5 |
.. |
86 |
16 |
„ |
||||
|
22. Malabar |
13 |
.. |
215 |
.. |
.. |
1,094 |
.. |
„ |
||||
|
23. The Nilgiris .. |
4 |
.. |
7 |
6 |
.. |
71 |
„ |
.. |
||||
|
24. South Canara |
0 |
.. |
181 |
.. |
.. |
281 |
ft |
|||||
|
Total . |
.. |
122 |
.. |
2,151 |
644 |
.. |
36,903 |
1,449 |
.. |
21 |
.. |
|
TABLE IV.—Statement showing the number of animals treated and castrated by Veterinary
Assistants and by Salustries on tour during the year 1912-13.
|
Province |
Number of villages |
Number of Veterinary |
Castrations |
Treated for conta- |
Treated for non-con- |
Total number of cases |
||||||||||
|
Eqnines. |
Bovines. |
Others. |
Total. |
Equines. |
Bovines. |
Others. |
Total. |
Equines. |
Bovines. |
Others. |
Total. |
|||||
|
Madras. |
By Touring Veteri- nary Assistants. |
5,118 |
26 |
42 |
1,139 |
87 |
1.268 |
32 |
4,744 |
75 |
4,851 |
493 |
2.881 |
254 |
3,628 |
9,747* |
|
By Salustries |
.. |
2 |
127 |
55 |
.. |
182 |
.. |
.. |
.. |
.. |
.. |
.. |
.. |
.. |
182 |
|
|
Total .. |
5,118 |
28 |
169 |
1,194 |
87 |
1,450 |
32 |
4,744 |
75 |
4,851 |
493 |
2,881 |
254 |
3,628 |
9,929 |
|
* In addition Veterinary Inspectors and the mobile corps treated 389 and castrated 228 animals respectively.
Set display mode to: Large image | Zoom image | Transcription
Images and transcriptions on this page, including medium image downloads, may be used under the Creative Commons Attribution 4.0 International Licence unless otherwise stated. ![]()
| Permanent URL | https://digital.nls.uk/75698932 |
|---|


