Medicine - Veterinary > Civil Veterinary Departments > 1893-1941 - Annual administration report of the Civil Veterinary Department in the Bombay Presidency > Civil Veterinary Dept. Bombay admin report 1914-1922 > 1921-1922 - Annual administration reports of the Bombay Veterinary College, Glanders and Farcy Department and Civil Veterinary Department in the Bombay Presidency (including Sind) for the year 1921-22
(427) Page 23
Download files
Individual page:
Thumbnail gallery: Grid view | List view

23
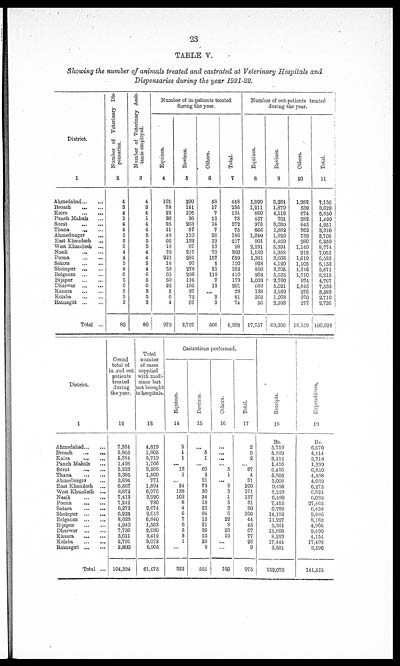
TABLE V.
Showing the number of animals treated and castrated at Veterinary Hospitals and
Dispensaries during the year 1921-22.
|
District. |
Number of Veterinary Dis- |
Number of Veterinary Assis- |
Number of in-patients treated |
Number of out-patients treated |
||||||
|
Equines. |
Bovines. |
Others. |
Total. |
Equines. |
Bovines. |
Others. |
Total. |
|||
|
1 |
2 |
3 |
4 |
5 |
6 |
7 |
8 |
9 |
10 |
11 |
|
Ahmedabad ... ... |
4 |
4 |
101 |
299 |
48 |
448 |
1,890 |
3,264 |
1,982 |
7,136 |
|
Broach ... ... |
3 |
3 |
78 |
141 |
17 |
236 |
1,211 |
1,879 |
539 |
3,629 |
|
Kaira ... ... |
4 |
4 |
22 |
105 |
7 |
134 |
860 |
4,116 |
674 |
5,650 |
|
Panch Mahals ... |
1 |
1 |
30 |
36 |
12 |
78 |
437 |
701 |
282 |
1,420 |
|
Surat ... ... |
4 |
4 |
95 |
263 |
14 |
372 |
976 |
3,030 |
845 |
4,851 |
|
Thana ... ... |
4 |
4 |
11 |
57 |
7 |
75 |
666 |
1,882 |
762 |
3,310 |
|
Ahmednagar ... |
5 |
5 |
48 |
110 |
28 |
186 |
1,040 |
1,929 |
739 |
3,708 |
|
East Khandesh ... |
5 |
5 |
66 |
132 |
19 |
217 |
901 |
4,469 |
980 |
6,350 |
|
West Khandesh ... |
5 |
5 |
18 |
67 |
13 |
98 |
2,231 |
5,394 |
1,149 |
8,774 |
|
Nasik ... ... |
4 |
4 |
70 |
217 |
73 |
360 |
1,180 |
4,958 |
915 |
7,053 |
|
Poona ... ... |
4 |
4 |
221 |
281 |
157 |
659 |
1,361 |
3,603 |
1,619 |
6,583 |
|
Satara ... ... |
5 |
5 |
18 |
97 |
5 |
120 |
928 |
4,120 |
1,105 |
6,153 |
|
Sholapur ... ... |
4 |
4 |
53 |
278 |
21 |
352 |
850 |
3,705 |
1,316 |
5,871 |
|
Belgaum ... ... |
6 |
6 |
65 |
226 |
119 |
410 |
968 |
5,535 |
1,710 |
8,213 |
|
Bijapur ... ... |
5 |
5 |
50 |
116 |
7 |
173 |
1,033 |
2,760 |
974 |
4,767 |
|
Dharwar ... ... |
6 |
6 |
22 |
166 |
13 |
201 |
669 |
5,021 |
1,845 |
7,535 |
|
Kanara ... ... |
3 |
3 |
1 |
27 |
... |
28 |
138 |
3,169 |
276 |
3,583 |
|
Kolaba ... ... |
5 |
5 |
6 |
72 |
3 |
81 |
362 |
1,978 |
370 |
2,710 |
|
Ratnagiri ... ... |
3 |
3 |
4 |
67 |
3 |
74 |
56 |
2,393 |
277 |
2,726 |
|
Total ... |
80 |
80 |
979 |
2,757 |
566 |
4,302 |
17,757 |
63,906 |
18,359 |
100,022 |
|
District. |
Grand |
Total |
Castrations performed. |
Receipts. |
Expenditure. |
|||
|
Equines. |
Bovines. |
Others. |
Total. |
|||||
|
1 |
12 |
13 |
14 |
15 |
16 |
17 |
18 |
19 |
|
Rs. |
Rs. |
|||||||
|
Ahmedabad ... ... |
7,584 |
4,819 |
2 |
... |
... |
2 |
5,759 |
6,670 |
|
Broach ...... |
3,865 |
1,805 |
1 |
5 |
... |
6 |
5,339 |
4,114 |
|
Kaira ... ... |
5,784 |
5,719 |
1 |
1 |
... |
2 |
8,112 |
3,718 |
|
Panch Mahals ... |
1,498 |
1,766 |
... |
... |
... |
... |
1,416 |
1,299 |
|
Surat ... ... |
5,223 |
3,266 |
13 |
69 |
5 |
87 |
6,436 |
6,850 |
|
Thana ... ... |
3,385 |
1,500 |
1 |
2 |
1 |
4 |
5,805 |
4,538 |
|
Ahmednagar ... |
3,894 |
771 |
... |
31 |
... |
31 |
5,008 |
4,039 |
|
East Khandesh ... |
6,567 |
1,894 |
24 |
73 |
3 |
100 |
9,496 |
6,275 |
|
West Khandesh ... |
8,872 |
6,976 |
138 |
30 |
3 |
171 |
8,229 |
6,322 |
|
Nasik ... ... |
7,413 |
3,920 |
102 |
34 |
1 |
137 |
6,490 |
6,039 |
|
Poona ... ... |
7,242 |
730 |
8 |
18 |
5 |
31 |
7,455 |
27,463 |
|
Satara ... ... |
6,273 |
2,674 |
4 |
23 |
3 |
30 |
6,789 |
6,458 |
|
Sholapur ... ... |
6,223 |
2,013 |
6 |
94 |
6 |
106 |
14,192 |
9,886 |
|
Belgaum ... ... |
8,623 |
6,840 |
7 |
15 |
22 |
44 |
11,227 |
8,162 |
|
Bijapur ... ... |
4,940 |
1,563 |
6 |
31 |
8 |
45 |
5,331 |
4,966 |
|
Dharwar ... ... |
7,736 |
2,030 |
5 |
36 |
26 |
67 |
15,808 |
9,490 |
|
Kanara ... ... |
3,611 |
3,412 |
3 |
55 |
19 |
77 |
8,233 |
4,154 |
|
Kolaba ... ... |
2,791 |
3,072 |
1 |
25 |
... |
26 |
17,444 |
17,492 |
|
Ratnagiri ... ... |
2,800 |
6,905 |
... |
9 |
... |
9 |
3,501 |
3,590 |
|
Total ... |
104,324 |
61,675 |
322 |
551 |
102 |
975 |
152,070 |
141,525 |
Set display mode to: Large image | Zoom image | Transcription
Images and transcriptions on this page, including medium image downloads, may be used under the Creative Commons Attribution 4.0 International Licence unless otherwise stated. ![]()
| Permanent URL | https://digital.nls.uk/75694488 |
|---|


