Medicine - Veterinary > Civil Veterinary Departments > 1893-1941 - Annual administration report of the Civil Veterinary Department in the Bombay Presidency > 1932-1941 - Civil Veterinary Dept. Bombay admin report 1932-41 > 1935-1936 - Annual administration reports of the Civil Veterinary Department, Bombay Presidency, including the Bombay Veterinary College; the Bombay City and Harbour Veterinary Department and the Civil Veterinary Department in Sind for the year 1935-36
(258) Page 22
Download files
Individual page:
Thumbnail gallery: Grid view | List view

22
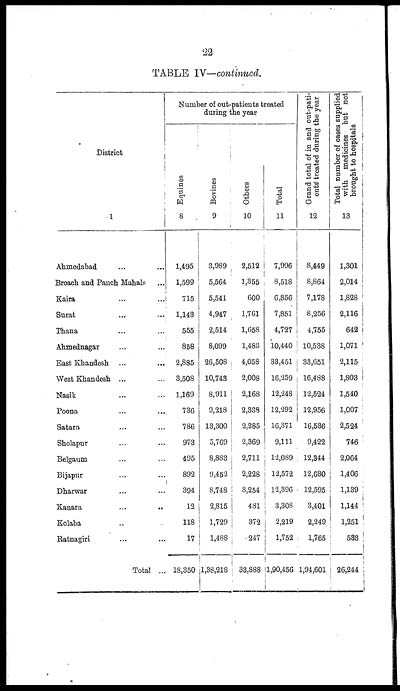
TABLE IV—continued.
|
District |
Number of out-patients treated |
Grand total of in and out-pati- |
Total number of cases supplied |
|||
|
Equines |
Bovines |
Others |
Total |
|||
|
1 |
8 |
9 |
10 |
11 |
12 |
13 |
|
Ahmedabad ... ... |
1,495 |
3,989 |
2,512 |
7,996 |
8,449 |
1,301 |
|
Broach and Panch Mahals ... |
1,599 |
5,564 |
1,355 |
8,518 |
8,864 |
2,014 |
|
Kaira ... ... |
715 |
5,541 |
600 |
6,856 |
7,178 |
1,828 |
|
Surat ... ... |
1,143 |
4,947 |
1,761 |
7,851 |
8,256 |
2,116 |
|
Thana ... ... |
555 |
2,514 |
1,658 |
4,727 |
4,755 |
642 |
|
Ahmednagar ... ... |
858 |
8,099 |
1,483 |
10,440 |
10,538 |
1,071 |
|
East Khandesh ... ... |
2,885 |
26,508 |
4,058 |
33,451 |
38,651 |
2,115 |
|
West Khandesh ... ... |
3,508 |
10,743 |
2,008 |
16,259 |
16,488 |
1,803 |
|
Nasik ... ... |
1,169 |
8,911 |
2,168 |
12,248 |
12,524 |
1,540 |
|
Poona ... ... |
736 |
9,218 |
2,338 |
12,292 |
12,956 |
1,007 |
|
Satara ... ... |
786 |
13,300 |
2,285 |
16,371 |
16,536 |
2,524 |
|
Sholapur ... ... |
973 |
5,769 |
2,369 |
9,111 |
9,422 |
746 |
|
Belgaum ... ... |
495 |
8,883 |
2,711 |
12,089 |
12,344 |
2,064 |
|
Bijapur ... ... |
892 |
9,452 |
2,228 |
12,572 |
12,630 |
1,406 |
|
Dharwar ... ... |
394 |
8,748 |
3,254 |
12,396 |
12,595 |
1,139 |
|
Kanara ... .. |
12 |
2,815 |
481 |
3,308 |
3,401 |
1,144 |
|
Kolaba .. |
118 |
1,729 |
372 |
2,219 |
2,249 |
1,251 |
|
Ratnagiri ... ... |
17 |
1,488 |
247 |
1,752 |
1,765 |
533 |
|
Total ... |
18,350 |
1,38,218 |
33,888 |
1,90,456 |
1,94,601 |
26,244 |
Set display mode to: Large image | Zoom image | Transcription
Images and transcriptions on this page, including medium image downloads, may be used under the Creative Commons Attribution 4.0 International Licence unless otherwise stated. ![]()
| Permanent URL | https://digital.nls.uk/75691120 |
|---|


