Medicine - Veterinary > Civil Veterinary Departments > 1893-1941 - Annual administration report of the Civil Veterinary Department in the Bombay Presidency > 1932-1941 - Civil Veterinary Dept. Bombay admin report 1932-41 > 1933-1934 - Annual administration reports of the Civil Veterinary Department, Bombay Presidency, including the Bombay Veterinary College; the Bombay City and Harbour Veterinary Department and the Civil Veterinary Department in Sind for the year 1933-34
(143) Page 21
Download files
Individual page:
Thumbnail gallery: Grid view | List view

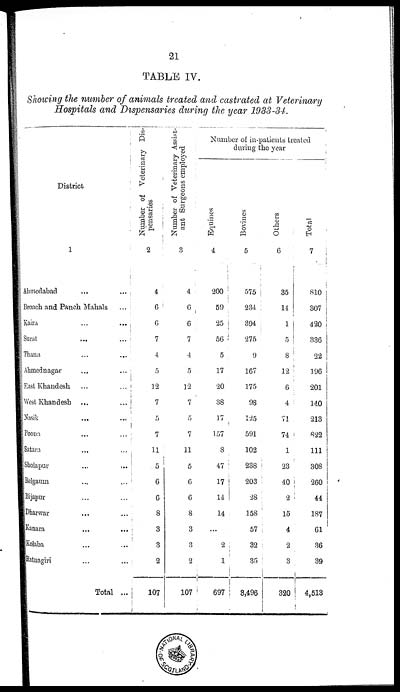
21
TABLE IV.
Showing the number of animals treated and castrated at Veterinary
Hospitals and Dispensaries during the year 1933-34.
|
District |
Number of Veterinary Dis- |
Number of Veterinary Assist- |
Number of in-patients treated |
|||
|
Equines |
Bovines |
Others |
Total |
|||
|
1 |
2 |
3 |
4 |
5 |
6 |
7 |
|
Ahmedabad ... ... |
4 |
4 |
200 |
575 |
35 |
810 |
|
Broach and Panch Mahals ... |
6 |
6 |
59 |
284 |
14 |
307 |
|
Kaira ... ... |
6 |
6 |
25 |
394 |
1 |
420 |
|
Surat ... ... |
7 |
7 |
56 |
275 |
5 |
336 |
|
Thana ... ... |
4 |
4 |
5 |
9 |
8 |
22 |
|
Ahmednagar ... ... |
5 |
5 |
17 |
167 |
12 |
196 |
|
East Khandesh ... ... |
12 |
12 |
20 |
175 |
6 |
201 |
|
West Khandesh ... ... |
7 |
7 |
38 |
98 |
4 |
140 |
|
Nasik ... ... |
5 |
5 |
17 |
125 |
71 |
213 |
|
Poona ... ... |
7 |
7 |
157 |
591 |
74 |
822 |
|
Satara ... ... |
11 |
11 |
8 |
102 |
1 |
111 |
|
Sholapur ... ... |
5 |
5 |
47 |
238 |
23 |
308 |
|
Belgaum ... ... |
6 |
6 |
17 |
203 |
40 |
260 |
|
Bijapur ... ... |
6 |
6 |
14 |
28 |
2 |
44 |
|
Dharwar ... ... |
8 |
8 |
14 |
158 |
15 |
187 |
|
Kanara ... ... |
3 |
3 |
... |
57 |
4 |
61 |
|
Kolaba ... ... |
8 |
8 |
2 |
32 |
2 |
36 |
|
Ratnagiri ... ... |
2 |
2 |
1 |
85 |
3 |
39 |
|
Total ... |
107 |
107 |
697 |
3,496 |
320 |
4,513 |
Set display mode to: Large image | Zoom image | Transcription
Images and transcriptions on this page, including medium image downloads, may be used under the Creative Commons Attribution 4.0 International Licence unless otherwise stated. ![]()
| Permanent URL | https://digital.nls.uk/75690775 |
|---|


