Medicine - Veterinary > Civil Veterinary Departments > 1893-1941 - Annual administration report of the Civil Veterinary Department in the Bombay Presidency > 1932-1941 - Civil Veterinary Dept. Bombay admin report 1932-41 > 1931-1932 - Annual administration reports of the Civil Veterinary Department, Bombay Presidency, including the Bombay Veterinary College; the Bombay City and Harbour Veterinary Department and the Civil Veterinary Department in Sind for the year 1931-32
(28) Page 22
Download files
Individual page:
Thumbnail gallery: Grid view | List view

22
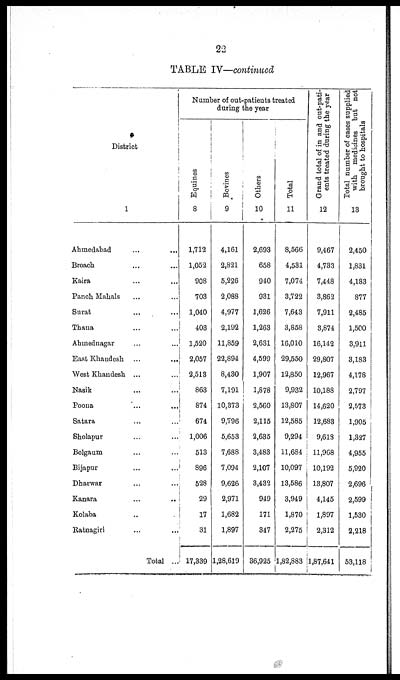
TABLE IV—continued
|
District |
Number of out-patients treated |
Grand total of in and out-pati- |
Total number of cases supplied |
|||
|
Equines |
Bovines |
Others |
Total |
|||
|
1 |
8 |
9 |
10 |
11 |
12 |
13 |
|
Ahmedabad ... ... |
1,712 |
4,161 |
2,693 |
8,566 |
9,467 |
2,450 |
|
Broach ... ... |
1,052 |
2,821 |
658 |
4,531 |
4,733 |
1,831 |
|
Kaira ... ... |
908 |
5,226 |
940 |
7,074 |
7,448 |
4,183 |
|
Panch Mahals ... ... |
703 |
2,088 |
931 |
3,722 |
3,862 |
877 |
|
Surat ... ... |
1,040 |
4,977 |
1,626 |
7,643 |
7,911 |
2,485 |
|
Thana ... ... |
403 |
2,192 |
1,263 |
3,858 |
3,874 |
1,500 |
|
Ahmednagar ... ... |
1,520 |
11,859 |
2,631 |
16,010 |
16,142 |
3,911 |
|
East Khandesh ... ... |
2,057 |
22,894 |
4,599 |
29,550 |
29,807 |
3,183 |
|
West Khandesh ... ... |
2,513 |
8,430 |
1,907 |
12,850 |
12,967 |
4,178 |
|
Nasik ... ... |
863 |
7,191 |
1,878 |
9,932 |
10,188 |
2,797 |
|
Poona ... ... |
874 |
10,373 |
2,560 |
13,807 |
14,620 |
2,573 |
|
Satara ... ... |
674 |
9,796 |
2,115 |
12,585 |
12,683 |
1,905 |
|
Sholapur ... ... |
1,006 |
5,653 |
2,635 |
9,294 |
9,618 |
1,327 |
|
Belgaum ... ... |
513 |
7,688 |
3,483 |
11,684 |
11,968 |
4,955 |
|
Bijapur ... ... |
896 |
7,094 |
2,107 |
10,097 |
10,192 |
5,920 |
|
Dharwar ... ... |
528 |
9,626 |
3,432 |
13,586 |
13,807 |
2,696 |
|
Kanara ... ... |
29 |
2,971 |
949 |
3,949 |
4,145 |
2,599 |
|
Kolaba ... ... |
17 |
1,682 |
171 |
1,870 |
1,897 |
1,530 |
|
Ratnagiri ... ... |
31 |
1,897 |
347 |
2,275 |
2,312 |
2,218 |
|
Total .. |
17,339 |
1,28,619 |
36,925 |
1,82,883 |
1,87,641 |
53,118 |
Set display mode to: Large image | Zoom image | Transcription
Images and transcriptions on this page, including medium image downloads, may be used under the Creative Commons Attribution 4.0 International Licence unless otherwise stated. ![]()
| Permanent URL | https://digital.nls.uk/75690436 |
|---|


