Medicine - Veterinary > Civil Veterinary Departments > 1893-1941 - Annual administration report of the Civil Veterinary Department in the Bombay Presidency > 1923-1931 - Civil Veterinary Dept. Bombay admin report 1923-31 > 1923-1924 - Annual administration reports of the Bombay Veterinary College, Bombay City and Harbour Veterinary Department and Civil Veterinary Department in the Bombay Presidency (including Sind) for the year 1923-24
(107) Page 33
Download files
Individual page:
Thumbnail gallery: Grid view | List view

33
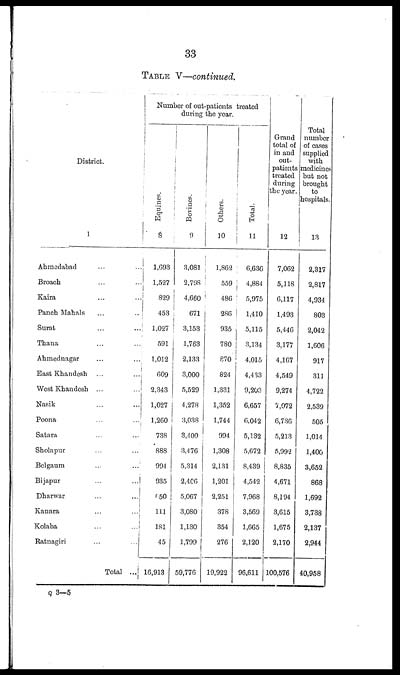
TABLE V—continued.
|
District. |
Number of out-patients treated |
Grand |
Total |
|||
|
Equines. |
Bovines. |
Others. |
Total. |
|||
|
1 |
8 |
9 |
10 |
11 |
12 |
13 |
|
Ahmedabad ... ... |
1,693 |
3,081 |
1,862 |
6,636 |
7,062 |
2,317 |
|
Broach ... ... |
1,527 |
2,798 |
559 |
4,884 |
5,118 |
2,817 |
|
Kaira ... ... |
829 |
4,660 |
486 |
5,975 |
6,117 |
4,934 |
|
Panch Mahals ... ... |
453 |
671 |
286 |
1,410 |
1,493 |
803 |
|
Surat ... ... |
1,027 |
3,153 |
935 |
5,115 |
5,446 |
2,042 |
|
Thana .. ... |
591 |
1,763 |
780 |
3,134 |
3,177 |
1,606 |
|
Ahmednagar ... ... |
1,012 |
2,133 |
870 |
4,015 |
4,167 |
917 |
|
East Khandesh ... ... |
609 |
3,000 |
824 |
4,433 |
4,549 |
311 |
|
West Khandesh ... ... |
2,343 |
5,529 |
1,331 |
9,203 |
9,274 |
4,722 |
|
Nasik ... ... |
1,027 |
4,278 |
1,352 |
6,657 |
7,072 |
2,539 |
|
Poona ... ... |
1,260 |
3,038 |
1,744 |
6,042 |
6,736 |
505 |
|
Satara ... ... |
738 |
3,400 |
994 |
5,132 |
5,213 |
1,014 |
|
Sholapur ... ... |
888 |
3,476 |
1,308 |
5,672 |
5,992 |
1,400 |
|
Belgaum ... ... |
994 |
5,314 |
2,131 |
8,439 |
8,835 |
3,652 |
|
Bijapur ... ... |
935 |
2,406 |
1,201 |
4,542 |
4,671 |
868 |
|
Dharwar ... ... |
650 |
5,067 |
2,251 |
7,968 |
8,194 |
1,692 |
|
Kanara ... ... |
111 |
3,080 |
378 |
3,569 |
3,615 |
3,738 |
|
Kolaba ... ... |
181 |
1,130 |
354 |
1,665 |
1,675 |
2,137 |
|
Ratnagiri ... ... |
45 |
1,799 |
276 |
2,120 |
2,170 |
2,944 |
|
Total ... |
16,913 |
59,776 |
19,922 |
96,611 |
100,576 |
40,958 |
Q 3—5
Set display mode to: Large image | Zoom image | Transcription
Images and transcriptions on this page, including medium image downloads, may be used under the Creative Commons Attribution 4.0 International Licence unless otherwise stated. ![]()
| Permanent URL | https://digital.nls.uk/75688707 |
|---|


