Medicine - Veterinary > Civil Veterinary Departments > 1893-1941 - Annual administration report of the Civil Veterinary Department in the Bombay Presidency > 1923-1931 - Civil Veterinary Dept. Bombay admin report 1923-31 > 1922-1923 - Annual administration reports of the Bombay Veterinary College, Glanders and Farcy Department and Civil Veterinary Department in the Bombay Presidency (including Sind) for the year 1922-23
(37) Page 31
Download files
Individual page:
Thumbnail gallery: Grid view | List view

31
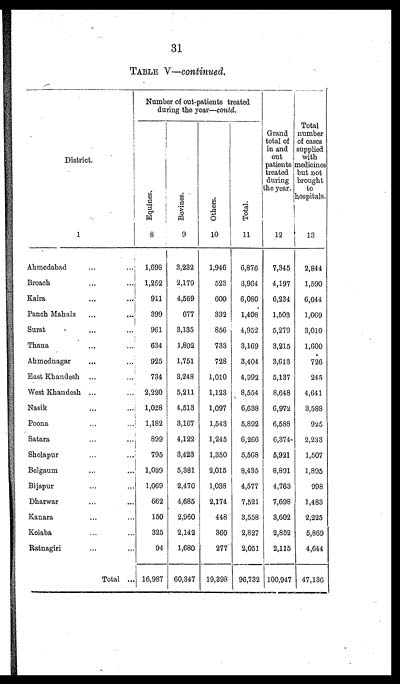
TABLE V—continued.
|
District. |
Number of out-patients treated |
Grand |
Total |
|||
|
Equines. |
Bovines. |
Others. |
Total. |
|||
|
1 |
8 |
9 |
10 |
11 |
12 |
13 |
|
Ahmedabad ... ... |
1,698 |
3,232 |
1,946 |
6,876 |
7,345 |
2,844 |
|
Broach ... ... |
1,262 |
2,179 |
523 |
3,964 |
4,197 |
1,590 |
|
Kaira ... ... |
911 |
4,569 |
600 |
6,080 |
6,234 |
6,044 |
|
Panch Mahals ... ... |
399 |
677 |
332 |
1,408 |
1,503 |
1,069 |
|
Surat ... ... |
961 |
3,135 |
856 |
4,952 |
5,279 |
3,010 |
|
Thana ... ... |
634 |
1,802 |
733 |
3,169 |
3,215 |
1,600 |
|
Ahmednagar ... ... |
925 |
1,751 |
728 |
3,404 |
3,613 |
726 |
|
East Khandesh ... ... |
734 |
3,248 |
1,010 |
4,992 |
5,137 |
245 |
|
West Khandesh ... ... |
2,220 |
5,211 |
1,123 |
8,554 |
8,648 |
4,641 |
|
Nasik ... ... |
1,028 |
4,513 |
1,097 |
6,638 |
6,972 |
3,588 |
|
Poona ... ... |
1,182 |
3,167 |
1,543 |
5,892 |
6,588 |
925 |
|
Satara ... ... |
899 |
4,122 |
1,245 |
6,266 |
6,374 |
2,233 |
|
Sholapur ... ... |
795 |
3,423 |
1,350 |
5,568 |
5,921 |
1,507 |
|
Belgaum ... ... |
1,039 |
5,381 |
2,015 |
8,435 |
8,891 |
1,895 |
|
Bijapur ... ... |
1,069 |
2,470 |
1,038 |
4,577 |
4,763 |
998 |
|
Dharwar ... ... |
662 |
4,685 |
2,174 |
7,521 |
7,698 |
1,483 |
|
Kanara ... ... |
150 |
2,960 |
448 |
3,558 |
3,602 |
2,225 |
|
Kolaba ... ... |
325 |
2,142 |
360 |
2,827 |
2,852 |
5,869 |
|
Ratnagiri ... ... |
94 |
1,680 |
277 |
2,051 |
2,115 |
4,644 |
|
Total ... |
16,987 |
60,347 |
19,398 |
96,732 |
100,947 |
47,136 |
Set display mode to: Large image | Zoom image | Transcription
Images and transcriptions on this page, including medium image downloads, may be used under the Creative Commons Attribution 4.0 International Licence unless otherwise stated. ![]()
| Permanent URL | https://digital.nls.uk/75688377 |
|---|


