

Medicine - Veterinary > Civil Veterinary Departments > 1893-1941 - Annual administration report of the Civil Veterinary Department in the Bombay Presidency > Civil Veterinary Dept. Bombay admin report 1907-1913 > Annual administration report of the Bombay Veterinary College and Civil Veterinary Department in the Bombay Presidency including Sind for the official year 1908-1909
(203) Page 41
Download files
Individual page:
Thumbnail gallery: Grid view | List view
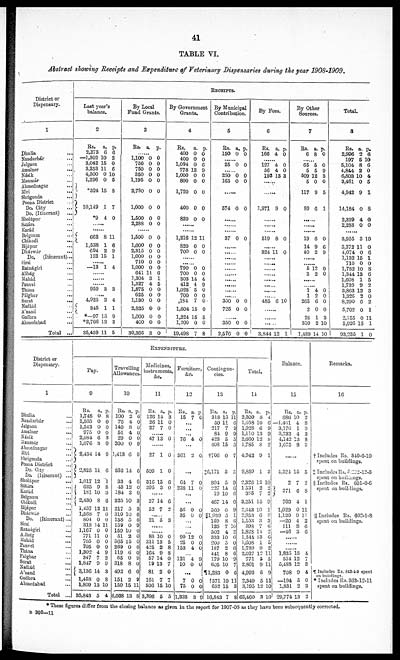
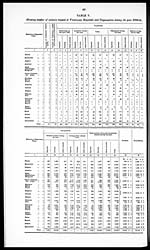
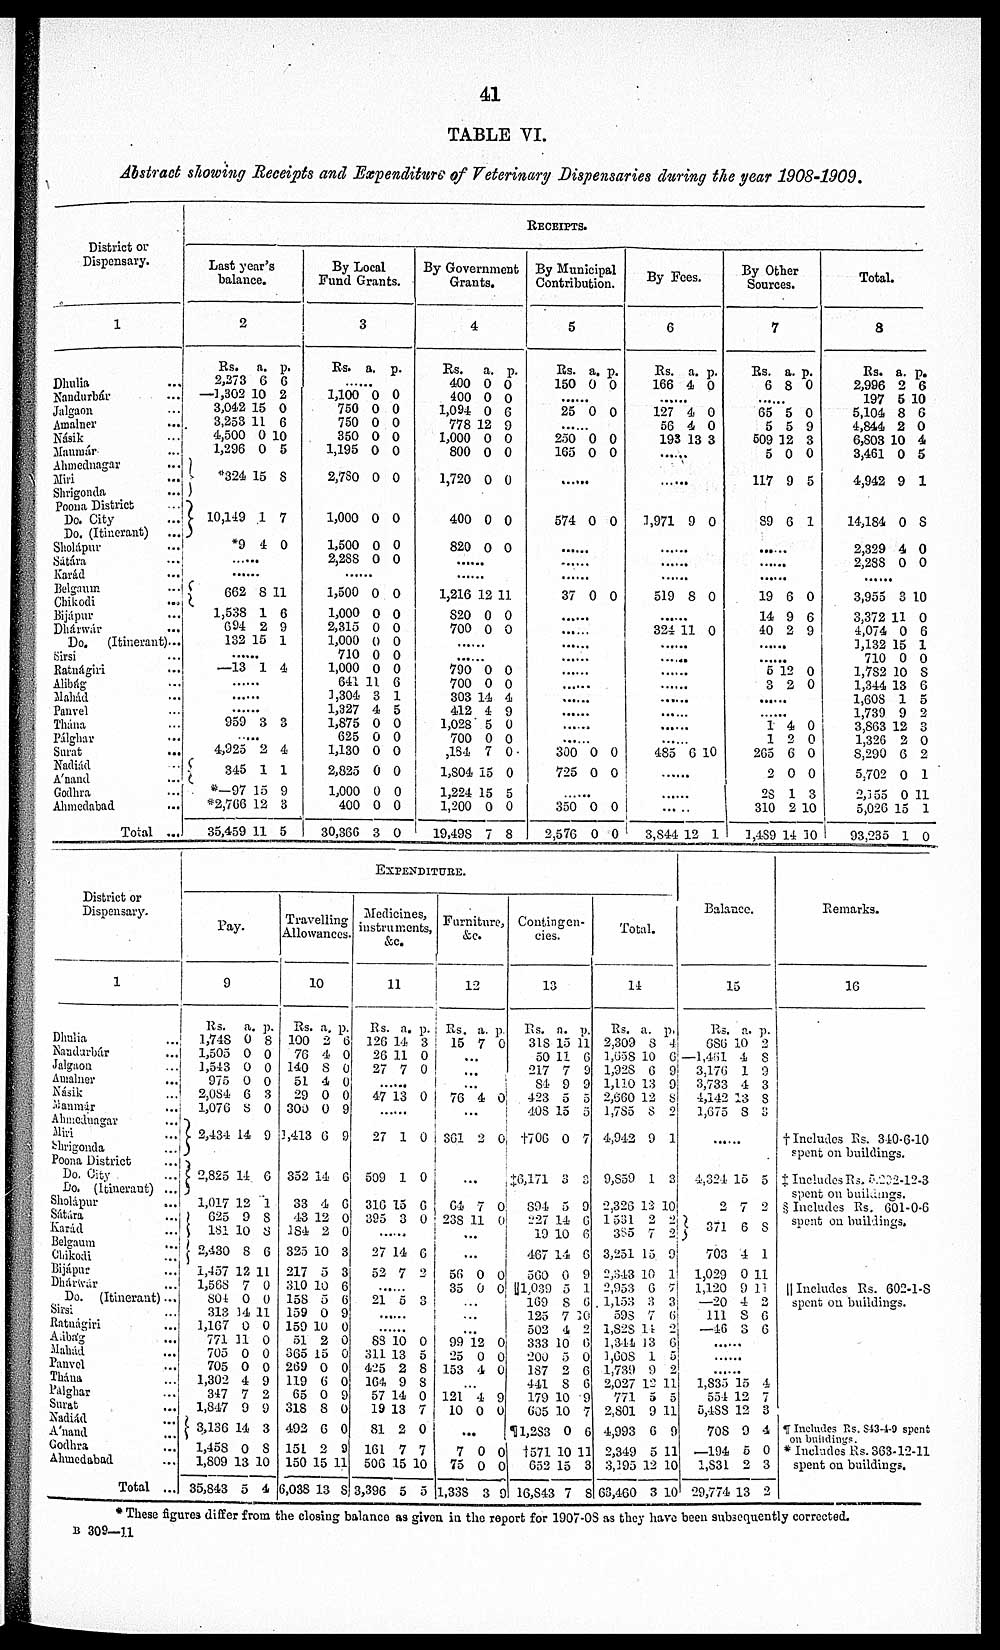
41
TABLE VI.
Abstract showing Receipts and Expenditure of Veterinary Dispensaries during the year 1908-1909.
|
District or |
RECEIPTS. |
||||||||||||||||||||
|
Last year's |
By Local |
By Government |
By Municipal |
By Fees. |
By Other |
Total. |
|||||||||||||||
|
1 |
2 |
3 |
4 |
5 |
6 |
7 |
8 |
||||||||||||||
|
Rs. |
a. |
p. |
Rs. |
a. |
p. |
Rs. |
a. |
p. |
Rs. |
a. |
p. |
Rs. |
a. |
p. |
Rs. |
a. |
p. |
Rs. |
a. |
p. |
|
|
Dhulia ... |
2,273 |
6 |
6 |
...... |
400 |
0 |
0 |
150 |
0 |
0 |
166 |
4 |
0 |
6 |
8 |
0 |
2,996 |
2 |
6 |
||
|
Nandurbár ... |
—1,302 1 |
0 |
2 |
1,100 |
0 |
0 |
400 |
0 |
0 |
...... |
197 |
5 1 |
0 |
||||||||
|
Jalgaon ... |
3,042 1 |
5 |
0 |
750 |
0 |
0 |
1,094 |
0 0 |
25 |
0 |
0 |
127 |
4 |
0 |
65 |
5 |
0 |
5,104 |
8 6 |
||
|
Amalner ... |
3,253 1 |
1 |
6 |
750 |
0 |
0 |
778 1 |
2 |
9 |
...... |
56 |
4 |
0 |
5 |
5 |
9 |
4,844 |
2 |
0 |
||
|
Násik ... |
4,500 |
0 1 |
0 |
350 |
0 |
0 |
1,000 |
0 |
0 |
250 |
0 |
0 |
193 |
13 |
3 |
509 1 |
2 |
3 |
6,803 1 |
0 |
4 |
|
Manmár ... |
1,296 |
0 |
5 |
1,195 |
0 |
0 |
800 |
0 |
0 |
165 |
0 |
0 |
...... |
5 |
0 |
0 |
3,461 |
0 |
5 |
||
|
Ahmednagar ... |
*324 1 |
5 |
8 |
2,780 |
0 |
0 |
1,720 |
0 |
0 |
...... |
...... |
117 |
9 |
5 |
4,942 |
9 |
1 |
||||
|
Miri ... |
|||||||||||||||||||||
|
Shrigonda ... |
|||||||||||||||||||||
|
Poona District ... |
10,149 |
1 |
7 |
1,000 |
0 |
0 |
400 |
0 |
0 |
574 |
0 |
0 |
1,971 |
9 |
0 |
89 |
6 |
1 |
14,184 |
0 |
8 |
|
Do. City |
|||||||||||||||||||||
|
Do. (Itinerant) ... |
|||||||||||||||||||||
|
Sholápur ... |
*9 |
4 |
0 |
1,500 |
0 |
0 |
820 |
0 |
0 |
...... |
...... |
...... |
2,329 |
4 |
0 |
||||||
|
Sátára ... |
...... |
2,288 |
0 |
0 |
...... |
...... |
...... |
...... |
2,288 |
0 |
0 |
||||||||||
|
Karád ... |
...... |
...... |
...... |
...... |
...... |
...... |
...... |
||||||||||||||
|
Belgaum ... |
662 |
8 |
11 |
1,500 |
0 |
0 |
1,216 |
12 1 |
1 |
37 |
0 |
0 |
519 |
8 |
0 |
19 |
6 |
0 |
3,955 |
3 |
10 |
|
Chikodi ... |
|||||||||||||||||||||
|
Bijápur ... |
1,538 |
1 |
6 |
1,000 |
0 |
0 |
820 |
0 |
0 |
...... |
...... |
14 |
9 |
6 |
3,372 |
11 |
0 |
||||
|
Dhárwir ... |
694 |
2 |
9 |
2,315 |
0 |
0 |
700 |
0 |
0 |
...... |
324 1 |
1 |
0 |
40 |
2 |
9 |
4,074 |
0 |
6 |
||
|
Do. (Itinerant)... |
132 |
15 |
1 |
1,000 |
0 |
0 |
...... |
...... |
...... |
...... |
3,132 |
15 |
1 |
||||||||
|
Sirsi ... |
...... |
710 |
0 |
0 |
...... |
...... |
...... |
710 |
0 |
0 |
|||||||||||
|
Ratnágiri ... |
—13 |
1 |
4 |
1,000 |
0 |
0 |
790 |
0 |
0 |
...... |
...... |
5 |
12 |
0 |
1,782 |
10 |
8 |
||||
|
Alibág ... |
...... |
641 1 |
1 |
6 |
700 |
0 |
0 |
...... |
...... |
3 |
2 |
0 |
1,344 |
13 |
6 |
||||||
|
Mahád ... |
...... |
3,304 |
3 |
1 |
303 |
14 |
4 |
...... |
...... |
...... |
1,608 |
1 |
5 |
||||||||
|
Panvel ... |
...... |
1,327 |
4 |
5 |
412 |
4 |
9 |
...... |
...... |
...... |
1,739 |
9 |
2 |
||||||||
|
Thána ... |
959 |
3 |
3 |
1,875 |
0 |
0 |
1,028 |
5 |
0 |
...... |
...... |
1 |
4 |
0 |
3,863 |
12 |
3 |
||||
|
Pálghar ... |
...... |
625 |
0 |
0 |
700 |
0 |
0 |
...... |
...... |
1 |
2 |
0 |
1,326 |
2 |
0 |
||||||
|
Surat ... |
4,925 |
2 |
4 |
1,130 |
0 |
0 |
184 |
7 |
0 |
300 |
0 |
0 |
485 |
6 |
10 |
265 |
6 |
0 |
8,290 |
6 |
2 |
|
Nadiád ... |
345 |
1 |
1 |
2,825 |
0 |
0 |
1,804 |
15 |
0 |
725 |
0 |
0 |
...... |
2 |
0 |
0 |
5,702 |
0 |
1 |
||
|
A'nand ... |
|||||||||||||||||||||
|
Godhra ... |
*—97 |
15 |
9 |
1,000 |
0 |
0 |
1,224 |
15 |
5 |
...... |
23 |
1 |
3 |
2,155 |
0 |
11 |
|||||
|
Ahmedabad ... |
*2,766 |
12 |
3 |
400 |
0 |
0 |
1,200 |
0 |
0 |
350 |
0 |
0 |
...... |
310 |
2 |
10 |
5,026 |
15 |
1 |
||
|
Total ... |
35,459 |
11 |
5 |
30,366 |
3 |
0 |
19,498 |
7 |
8 |
2,576 |
0 |
0 |
3,844 |
12 |
1 |
1,489 |
14 1 |
0 |
93,235 |
1 |
0 |
|
District or |
EXPENDITURE. |
Balance. |
Remarks. |
|||||||||||||||||||
|
Pay. |
Travelling |
Medicines, |
Furniture, |
Contingen- |
Total. |
|||||||||||||||||
|
1 |
9 |
10 |
11 |
12 |
13 |
14 |
15 |
16 |
||||||||||||||
|
Rs. |
a. |
p. |
Rs. |
a. |
p. |
Rs. |
a. |
p. |
Rs. |
a. |
p. |
Rs. |
a. |
p. |
Rs. |
a. |
p. |
Rs. |
a. |
p. |
||
|
Dhalia ... |
1,748 |
0 |
8 |
100 |
2 |
6 |
126 |
14 |
3 |
15 |
7 |
0 |
318 |
15 |
11 |
2,309 |
8 |
4 |
686 |
10 |
2 |
|
|
Naudarbár ... |
1,505 |
0 |
0 |
76 |
4 |
0 |
26 |
11 |
0 |
... |
50 |
11 |
6 |
1,658 |
10 |
6 |
—1,461 |
4 |
8 |
|||
|
Jalgaon ... |
1,543 |
0 |
0 |
140 |
8 |
0 |
27 |
7 |
0 |
... |
217 |
7 |
9 |
1,928 |
6 |
9 |
3,176 |
1 |
9 |
|||
|
Amalner ... |
975 |
0 |
0 |
51 |
4 |
0 |
...... |
... |
84 |
9 |
9 |
1,110 |
13 |
9 |
3,733 |
4 |
3 |
|||||
|
Násik ... |
2,084 |
6 |
3 |
29 |
0 |
0 |
47 |
13 |
0 |
76 |
4 |
0 |
423 |
5 |
5 |
2,560 |
12 |
8 |
4,142 |
13 |
8 |
|
|
Manmár ... |
1,076 |
8 |
0 |
300 |
0 |
9 |
...... |
... |
408 |
15 |
5 |
1,785 |
8 |
2 |
3,675 |
8 |
3 |
|||||
|
Ahmednagar ... |
2,434 |
14 |
9 |
1,413 |
6 |
9 |
27 |
1 |
0 |
361 |
2 |
0 |
†706 |
0 |
7 |
4,942 |
9 |
1 |
...... |
† Includes Rs. 340-6-10 |
||
|
Miri ... |
||||||||||||||||||||||
|
Shrigonda ... |
||||||||||||||||||||||
|
Poona District ... |
2,825 |
14 |
6 |
352 |
14 |
6 |
509 |
1 |
0 |
... |
‡6,171 |
3 |
3 |
9,859 |
1 |
3 |
4,324 |
15 |
5 |
‡ Includes Rs. 5,292-12-3 |
||
|
Do. City ... |
||||||||||||||||||||||
|
Do. (Itinerant) ... |
||||||||||||||||||||||
|
Sholápur ... |
1,017 |
12 |
1 |
33 |
4 |
6 |
316 |
15 |
6 |
64 |
7 |
0 |
894 |
5 |
9 |
2,326 |
13 |
10 |
2 |
7 |
2 |
§ Includes Rs. 601-0-6 |
|
Sátára ... |
625 |
9 |
8 |
43 |
12 |
0 |
395 |
3 |
0 |
238 |
11 |
0 |
227 |
14 |
6 |
1 531 |
2 |
2 |
371 6 8 |
|||
|
Karád ... |
181 |
10 |
8 |
184 |
2 |
0 |
...... |
... |
19 |
10 |
6 |
385 |
7 |
2 |
||||||||
|
Belgaum ... |
2,430 |
8 |
6 |
325 |
10 |
3 |
27 |
14 |
6 |
... |
467 |
14 |
6 |
3,251 |
15 |
9 |
703 |
4 |
1 |
|||
|
Bijápur ... |
1,457 |
12 1 |
1 |
217 |
5 |
3 |
52 |
7 |
2 |
56 |
0 |
0 |
560 |
0 |
9 |
2,343 |
10 |
1 |
1,029 |
0 |
11 |
|
|
Dhárwár ... |
1,568 |
7 |
0 |
310 |
10 |
6 |
... |
... |
35 |
0 |
0 |
||1,039 |
5 |
1 |
2,953 |
6 |
7 |
1,120 |
9 |
11 |
|| Includes Rs. 602-1-8 |
|
|
Do. (Itinerant) ... |
804 |
0 |
0 |
158 |
5 |
6 |
21 |
5 |
3 |
... |
169 |
8 |
6 |
1,153 |
3 |
3 |
—20 |
4 |
2 |
|||
|
Sirsi ... |
313 |
14 1 |
1 |
159 |
0 |
9 |
...... |
... |
125 |
7 |
30 |
598 |
7 |
6 |
111 |
8 |
6 |
|||||
|
Ratnágiri ... |
1,167 |
0 |
0 |
159 |
10 |
0 |
...... |
... |
502 |
4 |
2 |
1,828 |
14 |
2 |
—46 |
3 |
6 |
|||||
|
Alibág ... |
771 |
11 |
0 |
51 |
2 |
0 |
83 |
10 |
0 |
99 |
12 |
0 |
333 |
10 |
6 |
1,344 |
13 |
6 |
...... |
|||
|
Mahad ... |
705 |
0 |
0 |
365 |
15 |
0 |
311 |
13 |
5 |
25 |
0 |
0 |
200 |
5 |
0 |
1,608 |
1 |
5 |
...... |
|||
|
Panvel ... |
705 |
0 |
0 |
269 |
0 |
0 |
425 |
2 |
8 |
153 |
4 |
0 |
187 |
2 |
6 |
1,739 |
9 |
2 |
...... |
|||
|
Thána ... |
1,302 |
4 |
9 |
119 |
6 |
0 |
164 |
9 |
8 |
441 |
8 |
6 |
2,027 |
12 |
11 |
1,835 |
15 |
4 |
||||
|
Palghar ... |
347 |
7 |
2 |
65 |
0 |
9 |
57 |
14 |
0 |
121 |
4 |
9 |
179 |
10 |
9 |
771 |
5 |
5 |
554 |
12 |
7 |
|
|
Surat ... |
1,847 |
9 |
9 |
318 |
8 |
0 |
19 |
13 |
7 |
10 |
0 |
0 |
605 |
10 |
7 |
2,801 |
9 |
11 |
5,488 |
12 |
3 |
|
|
Nadiád ... |
3,136 |
14 |
3 |
492 |
6 |
0 |
81 |
2 |
0 |
.. |
. |
¶1,283 |
0 |
6 |
4,993 |
6 |
9 |
708 |
9 |
4 |
¶ Includes Rs. 843-4-9 spent |
|
|
A'nand ... |
||||||||||||||||||||||
|
Godhra ... |
1,458 |
0 |
8 |
151 |
2 |
9 |
161 |
7 |
7 |
7 |
0 |
0 |
†571 |
10 |
11 |
2,349 |
5 |
13 |
—194 |
5 |
0 |
* Includes Rs. 363-12-11 |
|
Ahmedabad ... |
1,809 |
13 |
10 |
150 |
15 |
11 |
506 |
15 |
10 |
75 |
0 |
0 |
652 |
15 |
3 |
3,195 |
12 |
10 |
1,831 |
2 |
3 |
|
|
Total ... |
35,843 |
5 |
4 |
6,038 |
13 |
8 |
3,396 |
5 |
5 |
1,338 |
3 |
9 |
16,843 |
7 |
8 |
63,460 |
3 |
10 |
29,774 |
13 |
2 |
|
* These figures differ from the closing balance as given in the report for 1907-08 as they have been subsequently corrected.
B 309—11
Set display mode to: Large image | Zoom image | Transcription
Images and transcriptions on this page, including medium image downloads, may be used under the Creative Commons Attribution 4.0 International Licence unless otherwise stated. ![]()
| Permanent URL | https://digital.nls.uk/75687114 |
|---|
| Description | Covers 1893-1941 and documents the work of the Bombay Presidency CVD. Records horse, mule and cattle breeding, stock lists, animal fairs, bacteriological work, disease outbreaks, veterinary education and staff activities. Supplemented by tables. |
|---|---|
| Shelfmark | IP/13/VB.3 |
| Additional NLS resources: | |
| Attribution and copyright: |
|
| Description | Reports dated 1887-1950 record activities of the Civil Veterinary Department across India. Plus minutes, memoirs and ledgers concerning veterinary officers and their work. |
|---|---|
| Shelfmark | India Papers |
| Description | The Veterinary collection consists of 146 volumes dating from 1864 to 1959. Divided into veterinary diseases, colleges and laboratories and Civil Veterinary Departments. Extensive research on trypanosomiasis and rinderpest. Reports show how veterinary medicine controlled disease, maintained livestock and alleviated famine. They explore its effect on military and local communities. |
|---|---|
| Shelfmark | India Papers |
| Description | The India Papers collection contains publications of the central (Imperial) Government and many Indian states. Most states came under British rule. Much of the collection dates from between the post-Mutiny re-organisation of the Indian Government and Indian Independence in 1947. Some items published in London by John Murray. |
|---|---|
| Shelfmark | India Papers |
| Additional NLS resources: | |