

Medicine - Veterinary > Civil Veterinary Departments > 1937-1946 - Annual administration report of the Civil Veterinary Department, Sind > 1939-1940 > Annual administration report of the Civil Veterinary Department, Sind, for the year 1939-40
(20) Page 16
Download files
Individual page:
Thumbnail gallery: Grid view | List view
16
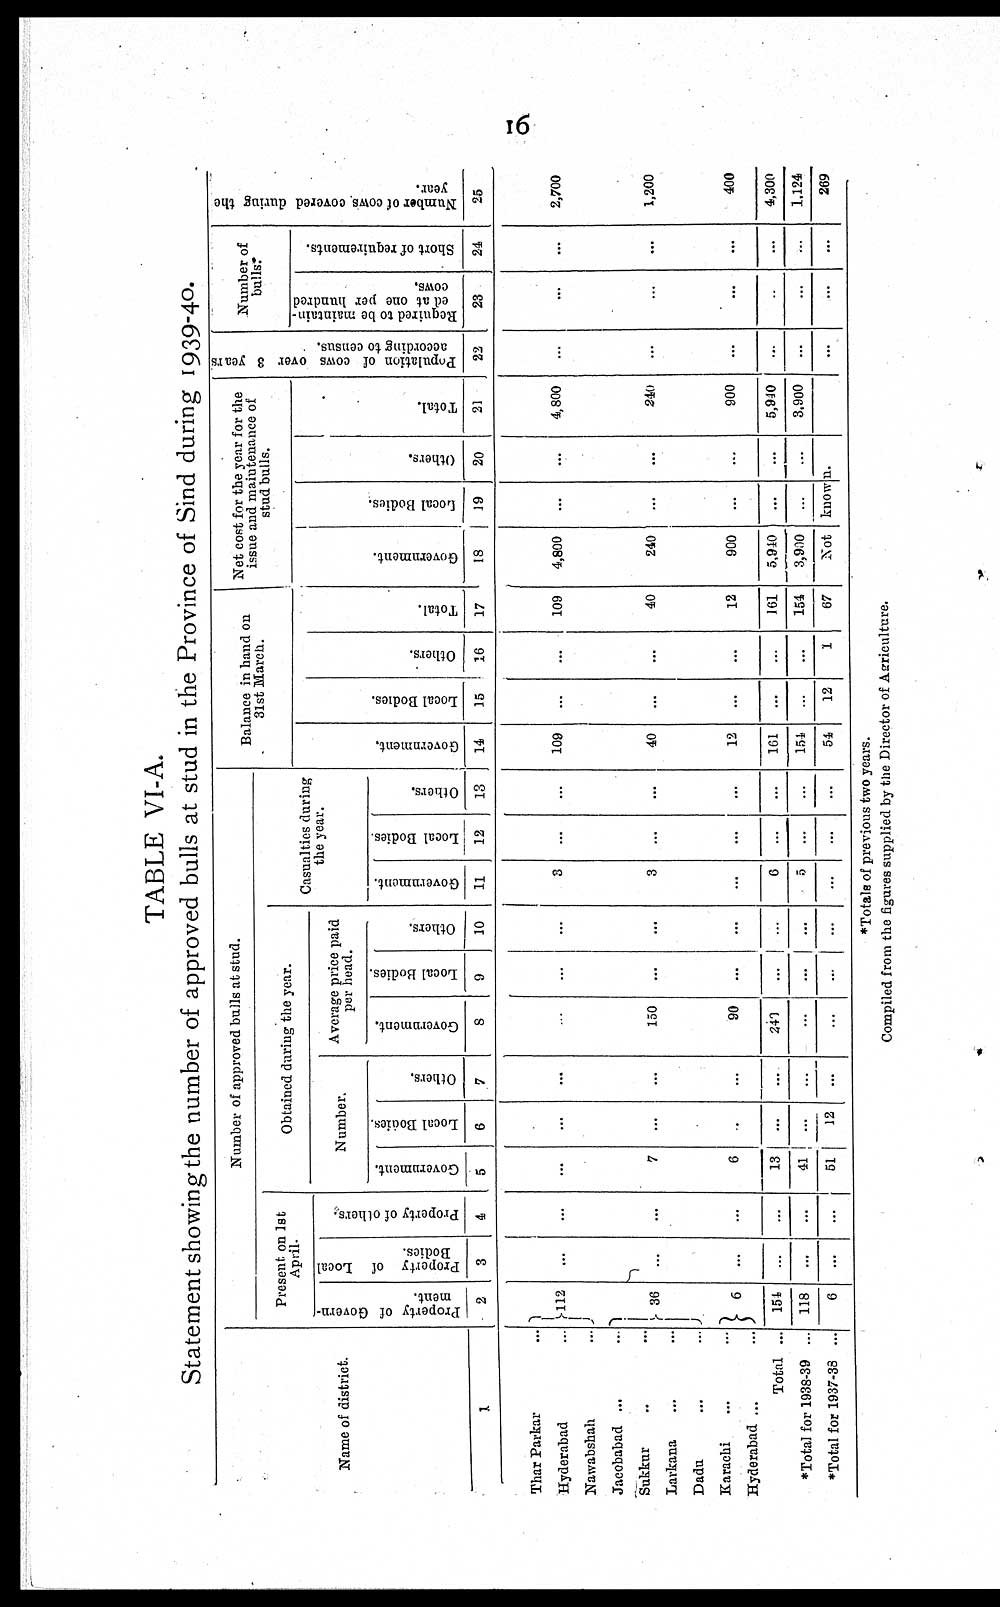
TABLE VI-A.
Statement showing the number of approved bulls at stud in the Province of Sind during 1939-40.
|
Name of district. |
Number of approved bulls at stud. |
Balance in hand on |
Net cost for the year for the |
Population of cows over 3 years |
Number of |
Number of cows covered during the |
||||||||||||||||||
|
Present on 1st |
Obtained during the year. |
Casualties during |
||||||||||||||||||||||
|
Property of Govern- |
Property of Local |
Property of others. |
Number. |
Average price paid |
Government. |
Local Bodies. |
Others. |
Total. |
Government. |
Local Bodies. |
Others. |
Total. |
Required to be maintain- |
Short of requirements. |
||||||||||
|
Government. |
Local Bodies. |
Others. |
Government. |
Local Bodies. |
Others. |
Government. |
Local Bodies. |
Others. |
||||||||||||||||
|
1 |
2 |
3 |
4 |
5 |
6 |
7 |
8 |
9 |
10 |
11 |
12 |
13 |
14 |
15 |
16 |
17 |
18 |
19 |
20 |
21 |
22 |
23 |
24 |
25 |
|
Thar Parkar ... |
112 |
... |
... |
... |
... |
... |
... |
... |
... |
3 |
... |
... |
109 |
... |
... |
109 |
4,800 |
... |
... |
4,800 |
... |
... |
... |
2,700 |
|
Hyderabad ... |
||||||||||||||||||||||||
|
Nawabshah ... |
||||||||||||||||||||||||
|
Jacobabad ... ... |
36 |
... |
... |
7 |
... |
... |
150 |
... |
... |
3 |
... |
... |
40 |
... |
... |
40 |
240 |
... |
... |
240 |
... |
... |
... |
1,200 |
|
Sukkur ... ... |
||||||||||||||||||||||||
|
Larkana ... ... |
||||||||||||||||||||||||
|
Dadu ... ... |
||||||||||||||||||||||||
|
Karachi ... ... |
6 |
... |
... |
6 |
... |
... |
90 |
... |
... |
... |
... |
... |
12 |
... |
... |
12 |
900 |
... |
... |
900 |
... |
... |
... |
400 |
|
Hyderabad ... ... |
||||||||||||||||||||||||
|
Total ... |
154 |
... |
... |
13 |
... |
... |
240 |
... |
... |
6 |
... |
... |
161 |
... |
... |
161 |
5,910 |
... |
... |
5,940 |
... |
... |
... |
4,300 |
|
*Total for 1938-39 ... |
118 |
... |
... |
41 |
... |
... |
... |
... |
... |
5 |
... |
... |
154 |
... |
... |
154 |
3,900 |
... |
... |
3,900 |
... |
... |
... |
1,124 |
|
*Total for 1937-38 ... |
6 |
... |
... |
51 |
12 |
... |
... |
... |
... |
... |
... |
... |
54 |
12 |
1 |
67 |
Not known. |
... |
... |
... |
269 |
|||
*Totals of previous two years.
Compiled from the figures supplied by the Director of Agriculture.
Set display mode to: Large image | Zoom image | Transcription
Images and transcriptions on this page, including medium image downloads, may be used under the Creative Commons Attribution 4.0 International Licence unless otherwise stated. ![]()
| Permanent URL | https://digital.nls.uk/75649083 |
|---|
| Description | Covers 1937-1946 and documents the work of the Sind CVD. Records horse, mule and cattle breeding, stock lists, animal fairs, bacteriological work, disease outbreaks, veterinary education and staff activities. Supplemented by tables. |
|---|---|
| Shelfmark | IP/15/VB.3 |
| Additional NLS resources: | |
| Attribution and copyright: |
|
| Description | Reports dated 1887-1950 record activities of the Civil Veterinary Department across India. Plus minutes, memoirs and ledgers concerning veterinary officers and their work. |
|---|---|
| Shelfmark | India Papers |
| Description | The Veterinary collection consists of 146 volumes dating from 1864 to 1959. Divided into veterinary diseases, colleges and laboratories and Civil Veterinary Departments. Extensive research on trypanosomiasis and rinderpest. Reports show how veterinary medicine controlled disease, maintained livestock and alleviated famine. They explore its effect on military and local communities. |
|---|---|
| Shelfmark | India Papers |
| Description | The India Papers collection contains publications of the central (Imperial) Government and many Indian states. Most states came under British rule. Much of the collection dates from between the post-Mutiny re-organisation of the Indian Government and Indian Independence in 1947. Some items published in London by John Murray. |
|---|---|
| Shelfmark | India Papers |
| Additional NLS resources: | |