Medicine - Veterinary > Civil Veterinary Departments > 1914-1940 - Annual administration report of the Civil Veterinary Department, Ajmere-Merwara, British Rajputana > 1934-1935 - Annual administration report of the Civil Veterinary Department in Ajmer-Merwara (British Rajputana), for the year 1934-35
(333) Page 7
Download files
Individual page:
Thumbnail gallery: Grid view | List view

7
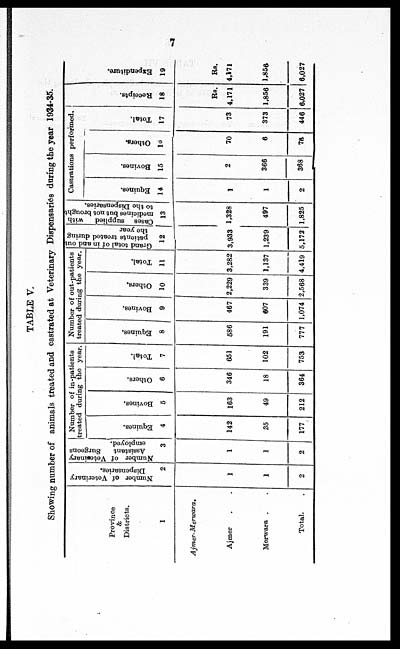
TABLE V.
Showing number of animals treated and castrated at Veterinary Dispensaries during the year 1934-35.
|
Province |
Number of Veterinary |
Number of Veterinary |
Number of in-patients |
Number of out-patients |
Grand total of in and out |
Cases supplied with |
Castrations performed. |
Receipts. |
Expenditure. |
|||||||||
|
Equines. |
Bovines. |
Others. |
Total. |
Equines. |
Bovines. |
Others. |
Total. |
Equines. |
Bovines. |
Others. |
Total. |
|||||||
|
1 |
2 |
3 |
4 |
5 |
6 |
7 |
8 |
9 |
10 |
11 |
12 |
13 |
14 |
15 |
16 |
17 |
18 |
19 |
|
Ajmer-Merwara. |
||||||||||||||||||
|
Rs. |
Rs. |
|||||||||||||||||
|
Ajmer . . |
1 |
1 |
142 |
163 |
346 |
651 |
586 |
467 |
2,229 |
3,282 |
3,933 |
1,328 |
1 |
2 |
70 |
73 |
4,171 |
4,171 |
|
Merwara . . |
1 |
1 |
35 |
49 |
18 |
102 |
191 |
607 |
339 |
1,137 |
1,239 |
497 |
1 |
366 |
6 |
373 |
1,856 |
1,856 |
|
Total. |
2 |
2 |
177 |
212 |
364 |
753 |
777 |
1,074 |
2,568 |
4,419 |
5,172 |
1,825 |
2 |
368 |
76 |
446 |
6,027 |
6,027 |
Set display mode to: Large image | Zoom image | Transcription
Images and transcriptions on this page, including medium image downloads, may be used under the Creative Commons Attribution 4.0 International Licence unless otherwise stated. ![]()
| Permanent URL | https://digital.nls.uk/75647581 |
|---|


