Medicine - Veterinary > Civil Veterinary Departments > 1914-1940 - Annual administration report of the Civil Veterinary Department, Ajmere-Merwara, British Rajputana > 1931-1932 - Annual administration report of the Civil Veterinary Department in Ajmer-Merwara (British Rajputana) for the year 1931-32
(284) Page 6
Download files
Individual page:
Thumbnail gallery: Grid view | List view

6
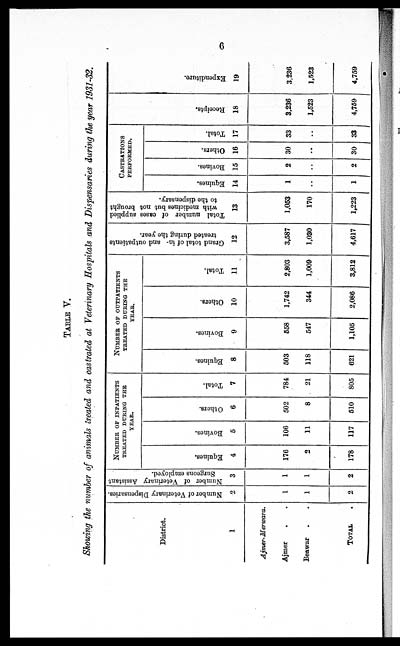
TABLE V.
Showing the number of animals treated and castrated at Veterinary Hospitals and Dispensaries during the year 1931-32.
|
District. |
Number of Veterinary Dispensaries. |
Number of Veterinary Assistant |
NUMBER OF INPATIENTS |
NUMBER OF OUTPATIENTS |
Grand total of in and outpatients |
Total number of cases supplied |
CASTRATIONS |
Receipts. |
Expenditure. |
|||||||||
|
Equines. |
Bovines. |
Others. |
Total. |
Equines. |
Bovines. |
Others. |
Total. |
Equines. |
Bovines. |
Others. |
Total. |
|||||||
|
1 |
2 |
3 |
4 |
5 |
6 |
7 |
8 |
9 |
10 |
11 |
12 |
13 |
14 |
15 |
16 |
17 |
18 |
19 |
|
Ajmer-Merwara. |
||||||||||||||||||
|
Ajmer . . |
1 |
1 |
176 |
106 |
502 |
784 |
503 |
558 |
1,742 |
2,803 |
3,587 |
1,053 |
1 |
2 |
30 |
33 |
3,236 |
3,236 |
|
Beawar . . |
1 |
1 |
2 |
11 |
8 |
21 |
118 |
547 |
344 |
1,009 |
1,030 |
170 |
.. |
.. |
.. |
.. |
1,523 |
1,523 |
|
TOTAL . |
2 |
2 |
178 |
117 |
510 |
805 |
621 |
1,105 |
2,086 |
3,812 |
4,617 |
1,223 |
1 |
2 |
30 |
33 |
4,759 |
4,759 |
Set display mode to: Large image | Zoom image | Transcription
Images and transcriptions on this page, including medium image downloads, may be used under the Creative Commons Attribution 4.0 International Licence unless otherwise stated. ![]()
| Permanent URL | https://digital.nls.uk/75646846 |
|---|


