Medicine - Veterinary > Civil Veterinary Departments > 1914-1940 - Annual administration report of the Civil Veterinary Department, Ajmere-Merwara, British Rajputana > 1929-1930 - Annual administration report of the Civil Veterinary Department in Ajmer-Merwara (British Rajputana) for the year 1929-30
(248) Page 8
Download files
Individual page:
Thumbnail gallery: Grid view | List view

8
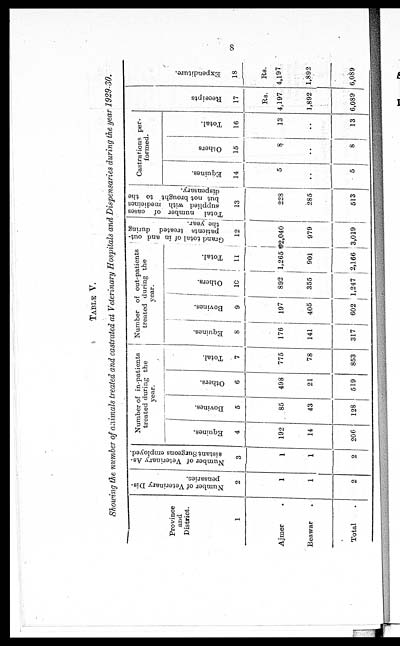
TABLE V.
Showing the number of animals treated and castrated at Veterinary Hospitals and Dispensaries during the year 1929-30.
|
Province |
Number of Veterinary Dis- |
Number of Veterinary As- |
Number of in-patients |
Number of out-patients the |
atients the |
Grand total of in and out- |
Total number of cases |
Castrations per- |
Receipts |
Expenditure. |
|||||||
|
Equines. |
Bovines. |
Others. |
Total. |
Equines. |
Bovines. |
Others. |
|
Equines. |
Others |
Total. |
|||||||
|
1 |
2 |
3 |
4 |
5 |
6 |
7 |
8 |
9 |
10 |
11 |
12 |
13 |
14 |
15 |
16 |
17 |
18 |
|
Rs. |
Rs. |
||||||||||||||||
|
Ajmer . |
1 |
1 |
192 |
85 |
498 |
775 |
176 |
197 |
892 |
1265 |
2,040 |
228 |
5 |
8 |
13 |
4,197 |
4,197 |
|
Beawar . |
1 |
1 |
14 |
43 |
21 |
78 |
141 |
405 |
355 |
901 |
979 |
285 |
.. |
.. |
.. |
1,892 |
1,892 |
|
Total . |
2 |
2 |
206 |
128 |
619 |
853 |
317 |
602 |
1,247 |
2,166 |
3,019 |
513 |
5 |
8 |
13 |
6,089 |
6,089 |
Set display mode to: Large image | Zoom image | Transcription
Images and transcriptions on this page, including medium image downloads, may be used under the Creative Commons Attribution 4.0 International Licence unless otherwise stated. ![]()
| Permanent URL | https://digital.nls.uk/75646738 |
|---|


