Medicine - Veterinary > Civil Veterinary Departments > 1914-1940 - Annual administration report of the Civil Veterinary Department, Ajmere-Merwara, British Rajputana > 1923-1924 - Annual administration report of the Civil Veterinary Department in Ajmer-Merwara (British Rajputana) for the year 1923-24
(146) Page 6
Download files
Individual page:
Thumbnail gallery: Grid view | List view

6
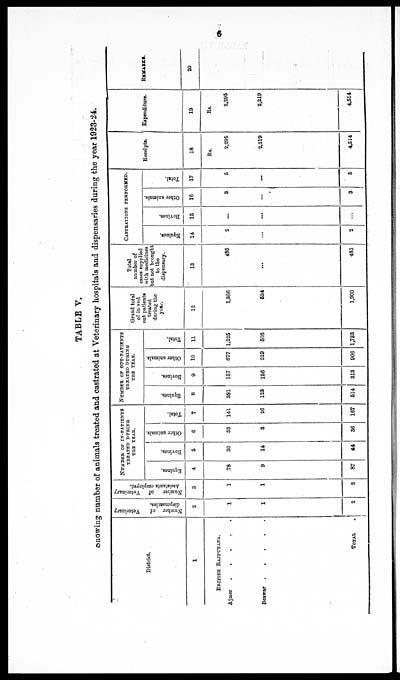
TABLE V.
Showing number of animals treated and castrated at Veterinary hospitals and dispensaries during the year 1923-24.
|
District. |
Number of Veterinary |
Number of Veterinary |
NUMBER OF IN-PATIENTS |
NUMBER OF OUT-PATIENTS |
Grand total |
Total |
CASTRATIONS PERFORMED. |
Receipts. |
Expenditure. |
REMARKS. |
|||||||||
|
Equines. |
Bovines. |
Other animals. |
Total. |
Equines. |
Bovines. |
Other animals. |
Total. |
Equines. |
Bovines. |
Other animals. |
Total. |
||||||||
|
1 |
2 |
3 |
4 |
5 |
6 |
7 |
8 |
9 |
10 |
11 |
12 |
13 |
14 |
15 |
16 |
17 |
18 |
19 |
20 |
|
BRITISH RAJPUTANA. |
Rs. |
Rs. |
|||||||||||||||||
|
Ajmer . . . . . |
1 |
1 |
78 |
30 |
33 |
141 |
391 |
157 |
677 |
1,225 |
1,366 |
485 |
2 |
... |
3 |
5 |
2,295 |
2,295 |
|
|
Beawar . . . . . |
1 |
1 |
9 |
14 |
3 |
26 |
123 |
156 |
229 |
508 |
534 |
... |
... |
... |
... |
... |
2,219 |
2,219 |
|
|
TOTAL . |
2 |
2 |
87 |
44 |
36 |
167 |
514 |
313 |
906 |
1,733 |
1,900 |
485 |
2 |
... |
3 |
5 |
4,514 |
4,514 |
|
Set display mode to: Large image | Zoom image | Transcription
Images and transcriptions on this page, including medium image downloads, may be used under the Creative Commons Attribution 4.0 International Licence unless otherwise stated. ![]()
| Permanent URL | https://digital.nls.uk/75646129 |
|---|


