Medicine - Veterinary > Civil Veterinary Departments > 1894-1932 - Annual report of the Punjab Veterinary College and of the Civil Veterinary Department, Punjab > 1894-1908 > 1895-1896 - Provincial report of the Civil Veterinary Department Punjab, for the year 1895-96
(89) Page 13
Download files
Individual page:
Thumbnail gallery: Grid view | List view

13
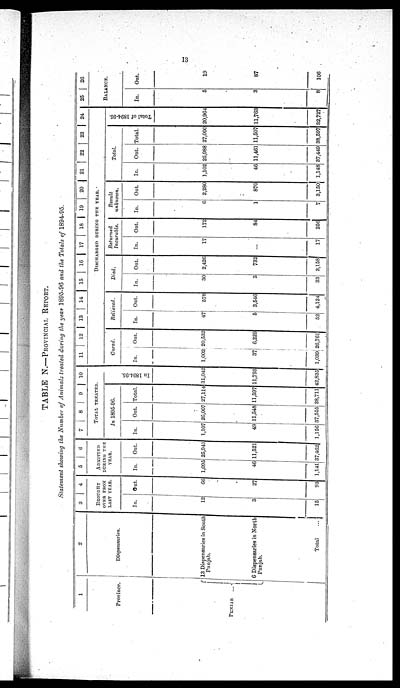
TABLE N.—PROVINCIAL REPORT.
Statement showing the Number of Animals treated during the year 1895-96 and the Totals of 1894-95.
|
1 |
2 |
3 |
4 |
5 |
6 |
7 |
8 |
9 |
10 |
11 |
12 |
13 |
14 |
15 |
16 |
17 |
18 |
19 |
20 |
21 |
22 |
23 |
24 |
25 |
26 |
|
Province. |
Dispensaries. |
BROUGHT |
ADMITTED |
TOTAL TREATED. |
DISCHARGED DURING THE YEAR. |
BALANCE. |
|||||||||||||||||||
|
In 1895-96. |
In 1894-95. |
Cured. |
Relieved. |
Died. |
Returned |
Result |
Total. |
Total of 1894-95. |
|||||||||||||||||
|
In. |
Out. |
In |
Out. |
In. |
Out. |
Total. |
In. |
Out. |
In. |
Out. |
In. |
Out. |
In. |
Out. |
In. |
Out. |
In. |
Out. |
Total. |
In. |
Out. |
||||
|
PUNJAB ... |
13 Dispensaries in South |
12 |
66 |
1,095 |
25,94 |
1,107 |
26,007 |
27,114 |
31,042 |
1,002 |
20,532 |
47 |
578 |
30 |
2,426 |
17 |
172 |
6 |
2,280 |
1,102 |
25,988 |
27,090 |
20,964 |
5 |
19 |
|
6 Dispensaries in North |
3 |
27 |
46 |
11,521 |
49 |
11,548 |
11,597 |
11,793 |
37 |
6,229 |
5 |
3,546 |
3 |
732 |
... |
84 |
1 |
870 |
46 |
11,461 |
11,507 |
11,763 |
3 |
87 |
|
|
Total ... |
15 |
93 |
1,141 |
37,462 |
1,156 |
37,555 |
38,711 |
42,835 |
1,039 |
26,761 |
52 |
4,124 |
33 |
3,158 |
17 |
256 |
7 |
3,150 |
1,148 |
37,449 |
38,597 |
32,727 |
8 |
106 |
|
Set display mode to: Large image | Zoom image | Transcription
Images and transcriptions on this page, including medium image downloads, may be used under the Creative Commons Attribution 4.0 International Licence unless otherwise stated. ![]()
| Permanent URL | https://digital.nls.uk/75528356 |
|---|
| Additional NLS resources: | |
|---|---|


