

Medicine - Veterinary > Civil Veterinary Departments > Statistics compiled by the Government of India from the reports of provincial Civil Veterinary Departments > 1911-1912
(16) Page 6
Download files
Individual page:
Thumbnail gallery: Grid view | List view
6
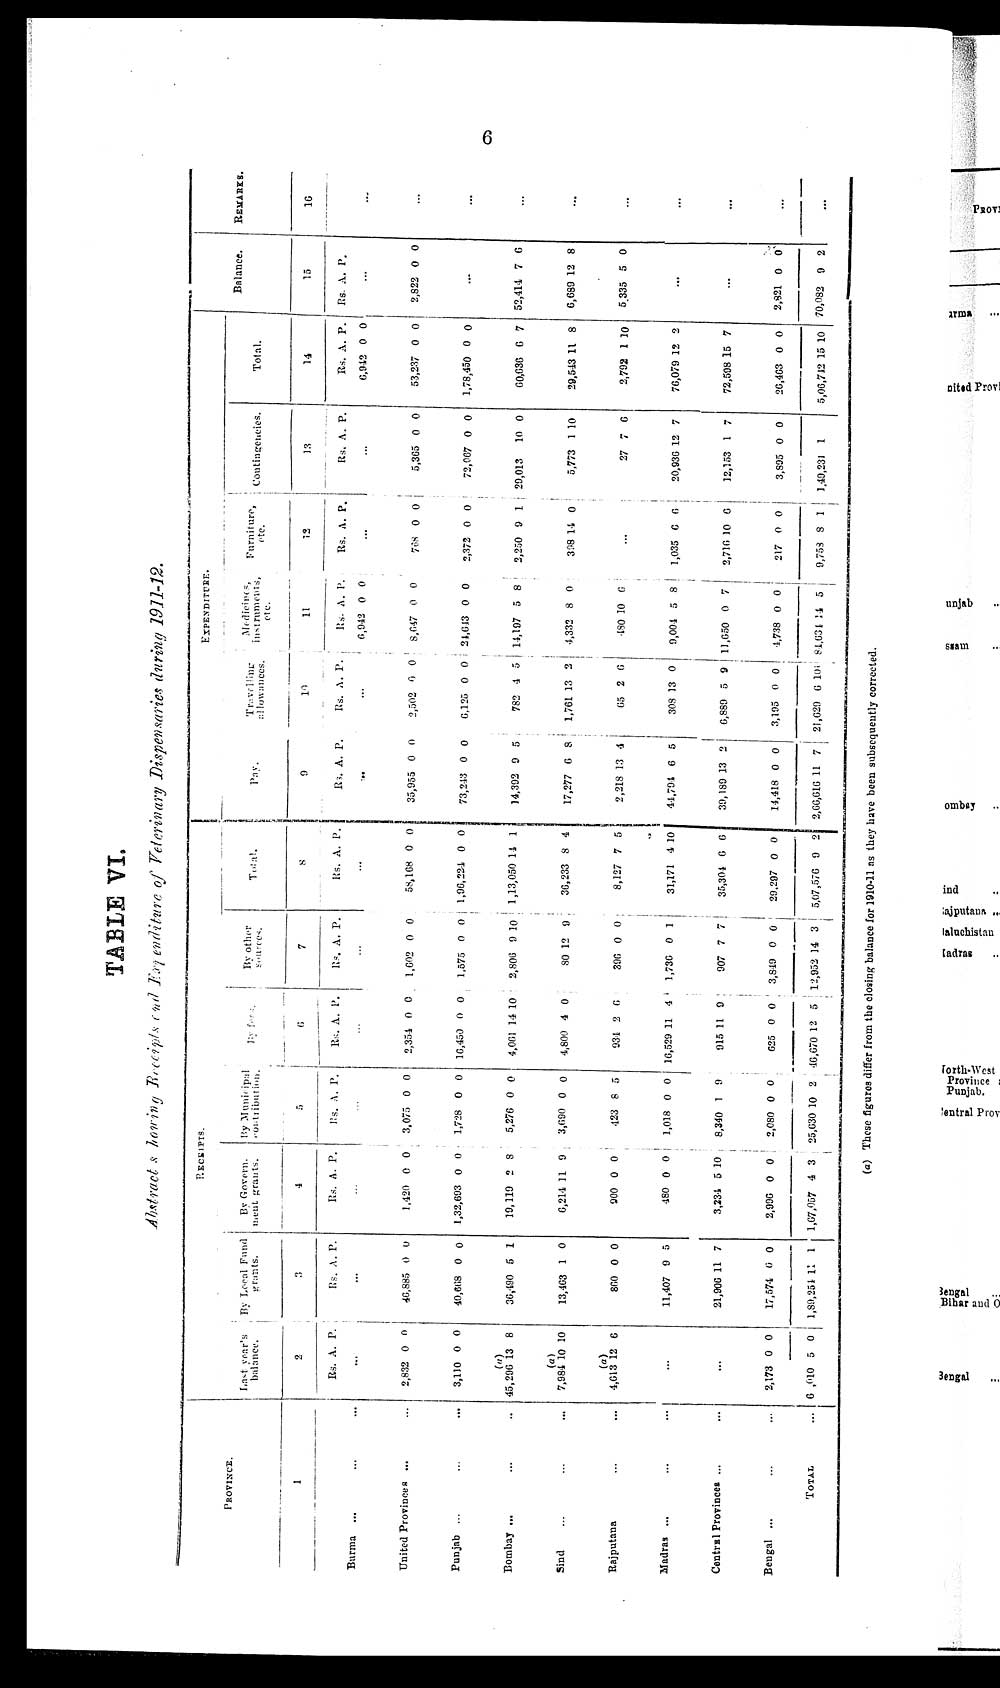
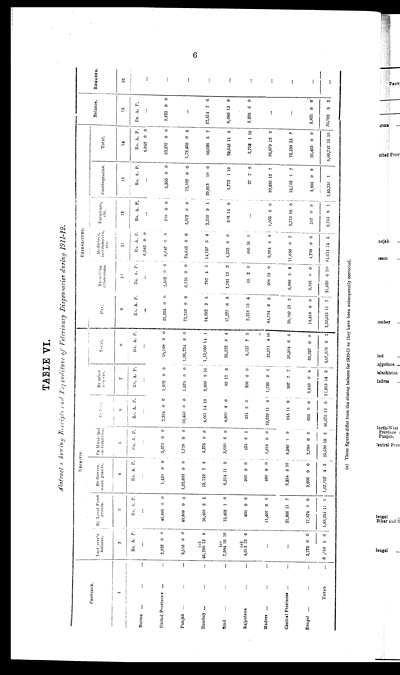
TABLE VI.
Abstract showing Receipts and Expenditure of Veterinary Dispensaries during 1911-12.
|
PROVINCE. |
RECEIPTS. |
EXPENDITURE. |
Balance. |
REMARKS. |
|||||||||||||||||||||||||||||||||||||||
|
Last year's |
By Local Fund grants. |
By Govern- ment grants. |
By Municipal |
By fees. |
By other sources. |
Total. |
Pay. |
Travelling |
Medicines, instruments, etc. |
Furniture, etc. |
Contingencies. |
Total. |
|||||||||||||||||||||||||||||||
|
1 |
2 |
3 |
4 |
5 |
6 |
7 |
8 |
9 |
10 |
11 |
12 |
13 |
14 |
15 |
16 |
||||||||||||||||||||||||||||
|
Rs. |
A. |
P. |
Rs. |
A. |
P. |
Rs. |
A. |
P. |
Rs. |
A. |
P. |
Rs. |
A. |
P. |
Rs. |
A. |
P. |
Rs. |
A. |
P. |
Rs. |
A. |
P. |
Rs. |
A. |
P. |
Rs. |
A. |
P. |
Rs. |
A. |
P. |
Rs. |
A. |
P. |
Rs. |
A. |
P. |
Rs. |
A. |
P. |
||
|
Burma ... ... ... |
... |
... |
... |
... |
... |
... |
... |
... |
... |
6,942 |
0 |
0 |
... |
... |
6,942 |
0 |
0 |
... |
... |
||||||||||||||||||||||||
|
United Provinces ... ... ... |
2,832 |
0 |
0 |
46,885 |
0 |
0 |
1,420 |
0 |
0 |
3,075 |
0 |
0 |
2,354 |
0 |
0 |
1,602 |
0 |
0 |
58,168 |
0 |
0 |
35,955 |
0 |
0 |
2,502 |
6 |
0 |
8,647 |
0 |
0 |
768 |
0 |
0 |
5,365 |
0 |
0 |
53,237 |
0 |
0 |
2,822 |
0 |
0 |
... |
|
Punjab ... ... ... ... |
3,110 |
0 |
0 |
40,668 |
0 |
0 |
1,32,693 |
0 |
0 |
1,728 |
0 |
0 |
16,450 |
0 |
0 |
1,575 |
0 |
0 |
1,96,224 |
0 |
0 |
73,243 |
0 |
0 |
6,125 |
0 |
0 |
24,643 |
0 |
0 |
2,372 |
0 |
0 |
72,067 |
0 |
0 |
1,78,450 |
0 |
0 |
... |
... |
||
|
Bombay ... ... ... |
45,296 |
(a) 13 |
8 |
36,490 |
5 |
1 |
19,119 |
2 |
8 |
5,276 |
0 |
0 |
4,061 |
14 |
10 |
2,806 |
9 |
10 |
1,13,050 |
14 |
1 |
14,392 |
9 |
5 |
782 |
4 |
5 |
14,197 |
5 |
8 |
2,250 |
9 |
1 |
29,013 |
10 |
0 |
60,636 |
6 |
7 |
52,414 |
7 |
6 |
... |
|
Sind ... ... ... |
7,984 |
(a) |
10 |
13,463 |
1 |
0 |
6,214 |
11 |
9 |
3,690 |
0 |
0 |
4,800 |
4 |
0 |
80 |
12 |
9 |
36,233 |
8 |
4 |
17,277 |
6 |
8 |
1,761 |
13 |
2 |
4,332 |
8 |
0 |
398 |
14 |
0 |
5,773 |
1 |
10 |
29,543 |
11 |
8 |
6,689 |
12 |
8 |
... |
|
Rajputana ... ... ... |
4,613 |
(a) |
6 |
860 |
0 |
0 |
900 |
0 |
0 |
423 |
8 |
5 |
934 |
2 |
6 |
396 |
0 |
0 |
8,127 |
7 |
5 |
2,218 |
13 |
4 |
65 |
2 |
6 |
480 |
10 |
6 |
... |
27 |
7 |
6 |
2,792 |
1 |
10 |
5,335 |
5 |
0 |
... |
||
|
Madras ... ... ... |
... |
11,407 |
9 |
5 |
480 |
0 |
0 |
1,018 |
0 |
0 |
16,529 |
11 |
4 |
1,736 |
0 |
1 |
31,171 |
4 |
10 |
44,794 |
6 |
5 |
308 |
13 |
0 |
9,004 |
5 |
8 |
1,035 |
6 |
6 |
20,936 |
12 |
7 |
76,079 |
12 |
2 |
... |
... |
||||
|
Central Provinces ... ... |
... |
21,906 |
11 |
7 |
3,234 |
5 |
10 |
8,340 |
1 |
9 |
915 |
11 |
9 |
907 |
7 |
7 |
35,304 |
6 |
6 |
39,189 |
13 |
2 |
6,889 |
5 |
9 |
11,650 |
0 |
7 |
2,716 |
10 |
6 |
12,153 |
1 |
7 |
72,598 |
15 |
7 |
... |
... |
||||
|
Bengal ... ... ... |
2,173 |
0 |
0 |
17,574 |
0 |
0 |
2,996 |
0 |
0 |
2,080 |
0 |
0 |
625 |
0 |
0 |
3,849 |
0 |
0 |
29,297 |
0 |
0 |
14,418 |
0 |
0 |
3,195 |
0 |
0 |
4,738 |
0 |
0 |
217 |
0 |
0 |
3,895 |
0 |
0 |
26,463 |
0 |
0 |
2,821 |
0 |
0 |
... |
|
TOTAL ... |
6, 010 |
5 |
0 |
1,89,254 |
11 |
1 |
1,67,057 |
4 |
3 |
25,630 |
10 |
2 |
46,670 |
12 |
5 |
12,952 |
14 |
3 |
5,07,576 |
9 |
2 |
2,66,616 |
11 |
7 |
21,629 |
6 |
10 |
81,634 |
14 |
5 |
9,758 |
8 |
1 |
1,49,231 |
1 |
5,06,742 |
15 |
10 |
70,082 |
9 |
2 |
... |
|
(a) These figures differ from the closing balance for 1910-11 as they have been subsequently corrected.
Set display mode to: Large image | Zoom image | Transcription
Images and transcriptions on this page, including medium image downloads, may be used under the Creative Commons Attribution 4.0 International Licence unless otherwise stated. ![]()
| Permanent URL | https://digital.nls.uk/75510712 |
|---|
| Description | Title on spine - Provincial Civil Veterinary Department statistics 1911-20. Extensive tables show students, veterinary assistants, Imperial Bacteriological Laboratory workings, horse fairs and shows, horses, cattle farms, contagious diseases and inoculations of animals throughout India. |
|---|---|
| Shelfmark | IP/RA.6 |
| Additional NLS resources: | |
| Attribution and copyright: |
|
| Description | Reports dated 1887-1950 record activities of the Civil Veterinary Department across India. Plus minutes, memoirs and ledgers concerning veterinary officers and their work. |
|---|---|
| Shelfmark | India Papers |
| Description | The Veterinary collection consists of 146 volumes dating from 1864 to 1959. Divided into veterinary diseases, colleges and laboratories and Civil Veterinary Departments. Extensive research on trypanosomiasis and rinderpest. Reports show how veterinary medicine controlled disease, maintained livestock and alleviated famine. They explore its effect on military and local communities. |
|---|---|
| Shelfmark | India Papers |
| Description | The India Papers collection contains publications of the central (Imperial) Government and many Indian states. Most states came under British rule. Much of the collection dates from between the post-Mutiny re-organisation of the Indian Government and Indian Independence in 1947. Some items published in London by John Murray. |
|---|---|
| Shelfmark | India Papers |
| Additional NLS resources: | |