

Medicine - Institutions > Army health reports and medical documents > Scientific memoirs by officers of the Medical and Sanitary Departments of the Government of India > Number 37 - Investigations on Bengal jail dietaries > Part II > Relationship of food to physical development
(227) Page 217
Download files
Individual page:
Thumbnail gallery: Grid view | List view
217
is a function of the protein metabolism possible from the diet. It is worthy of
note that there is very little dysentery, diarrhœa or bowel complaint present
amongst the individuals of these tribes. The stools are well-formed and regular,
and very much a contrast to the semi-fluid excretion of the Bengali.
We made some observations on the blood of the Bhutias and Nepalese in
Darjeeling jail, but no difference of importance could be detected. Thus the
average of 28 observations gave:—
| Bhutea. | Nepalese. | |||||||
| Hæmoglobin | 84% | 84% | ||||||
| Red b. Corps | 5,360,000 | 5,280,000 | ||||||
| White b. Corps | 9,740 | 9,660 | ||||||
As these prisoners get the same diet while under confinement in all probability
any racial differences in the composition of the blood would have disappeared.
It was found impossible to get blood from these outside the walls of the jail, so
that differences may exist.
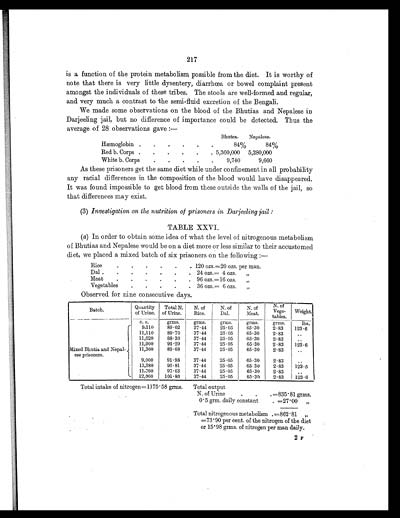
(3) Investigation on the nutrition of prisoners in Darjeeling jail:
TABLE XXVI.
(a) In order to obtain some idea of what the level of nitrogenous metabolism
of Bhutias and Nepalese would be on a diet more or less similar to their accustomed
diet, we placed a mixed batch of six prisoners on the following:—
| Rice | 120 ozs.=20 ozs. per man. | |||||||
| Dal | 24 ozs.= 4 ozs. „ | |||||||
| Meat | 96 ozs.= 16 ozs. „ | |||||||
| Vegetables | 36 ozs.= 6 ozs. „ | |||||||
| Batch. | Quantity of Urine. |
Total N. of Urine. |
N. of Rice. |
N. of Dal. |
N. of Meat. |
N. of Vege- tables. |
Weight. | ||
| c. c. | grms. | grms. | grms. | grms. | grms. | lbs. | |||
| Mixed Bhutia and Nepal- ese prisoners. |
9,110 | 89.62 | 37.44 | 25.05 | 65.30 | 2.83 | 123.6 | ||
| 11,110 | 89.70 | 37.44 | 25.05 | 65.30 | 2.83 | .. | |||
| 11,620 | 88.30 | 37.44 | 25.05 | 65.30 | 2.83 | .. | |||
| 11,900 | 91.29 | 37.44 | 25.05 | 65.30 | 2.83 | 123.6 | |||
| 11,300 | 89.68 | 37.44 | 25.05 | 65.30 | 2.83 | .. | |||
| 9,000 | 91.98 | 37.44 | 25.05 | 65.30 | 2.83 | .. | |||
| 13,380 | 95.81 | 37.44 | 25.05 | 65.30 | 2.83 | 123.5 | |||
| 11,760 | 97.63 | 37.44 | 25.05 | 65.30 | 2.83 | .. | |||
| 12,000 | 101.80 | 37.44 | 25.05 | 65.30 | 2.83 | 123.6 | |||
| Total intake of nitrogen=1175.58 grms. | Total output | ||||
| N. of Urine | =835.81 grms. | ||||
| 0.5 grm. daily constant | = 27.00 „ | ||||
| Total nitrogenous metabolism | =862.81 „ | ||||
| = 73.90 per cent. of the nitrogen of the diet | |||||
| or 15.98 grms. of nitrogen per man daily. | |||||
2 F
Set display mode to: Large image | Zoom image | Transcription
Images and transcriptions on this page, including medium image downloads, may be used under the Creative Commons Attribution 4.0 International Licence unless otherwise stated. ![]()
| Permanent URL | https://digital.nls.uk/75033396 |
|---|
| Description | With some observations on the influence of dietary on the physical development and well-being of the people of Bengal by D. McCay. |
|---|---|
| Shelfmark | IP/QB.10 |
| Additional NLS resources: | |
| Description | 61 volume new series covers bacteriological research work from 1902-1913 by Indian Medical Service staff. Laboratory experiments are recorded in detail. Many are accompanied by illustrations showing microscopic views and features of plant and animal matter. (Calcutta : Supt. of Govt. Print., India, 1885-1901.) |
|---|---|
| Shelfmark | IP/QB.10 |
| Description | 12 titles describe the health and sanitary conditions of the army in India. Lists British, European and Indian troops plus families of military personnel. 3 volumes of army regulations included. 73 volumes make up the Scientific Memoirs series, a journal by Indian Medical Service staff. |
|---|---|
| Description | The Institutions collection consists of 106 volumes from British India, dating from the 1860's to the 1940's. Divided into reports on medical institutions, army health, and lock hospitals. Education of indigenous medical students and maintenance of troop health shown in annual reports and statistical tables. |
|---|---|
| Description | The India Papers collection contains publications of the central (Imperial) Government and many Indian states. Most states came under British rule. Much of the collection dates from between the post-Mutiny re-organisation of the Indian Government and Indian Independence in 1947. Some items published in London by John Murray. |
|---|---|
| Shelfmark | India Papers |