

Medicine - Institutions > Army health reports and medical documents > Scientific memoirs by officers of the Medical and Sanitary Departments of the Government of India > Number 37 - Investigations on Bengal jail dietaries > Part I > Chapter IV - Effects of the large quantity of salt given in Bengal jail dietaries
(182) Page 172
Download files
Individual page:
Thumbnail gallery: Grid view | List view
172
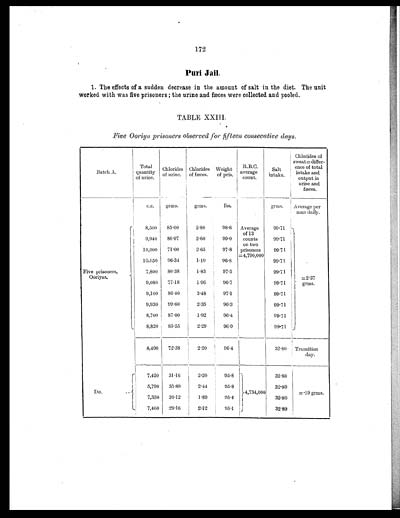
Puri Jail.
1. The effects of a sudden decrease in the amount of salt in the diet. The unit
worked with was five prisoners; the urine and fæces were collected and pooled.
TABLE XXIII.
Five Ooriya prisoners observed for fifteen consecutive days.
| Batch A. | Total quantity of urine. |
Chlorides of urine. |
Chlorides of fæces. |
Weight of pris. |
R.B.C. average count. |
Salt intake. |
Chlorides of sweat=differ- ence of total intake and output in urine and fæces. |
| c.c. | grms. | grms. | lbs. | grms. | Average per man daily. |
||
| Five prisoners, Ooriyas. |
8,500 | 85.00 | 2.80 | 98.6 | Average of 13 counts on two prisoners =4,790,000 |
99.71 | =2.37 grms. |
| 9,940 | 86.97 | 2.60 | 99.0 | 99.71 | |||
| 10,000 | 71.00 | 2.65 | 97.8 | 99.71 | |||
| 10,150 | 06.34 | 1.10 | 96.8 | 99.71 | |||
| 7,800 | 80.38 | 1.83 | 97.5 | 99.71 | |||
| 9,080 | 77.18 | 1.96 | 96.7 | 99.71 | |||
| 9,100 | 86.40 | 3.48 | 97.1 | 99.71 | |||
| 9,930 | 99.60 | 2.35 | 96.3 | 99.71 | |||
| 8,700 | 87.00 | 1.92 | 96.4 | 99.71 | |||
| 8,820 | 85.55 | 2.29 | 96.9 | 99.71 | |||
| 8,490 | 72.38 | 2.20 | 96.4 | 32.80 | Transition day. |
||
| Do. | 7,420 | 31.16 | 2.20 | 95.8 | 4,734,000 | 32.80 | =.19 grms. |
| 5,790 | 35.89 | 2.44 | 95.8 | 32.80 | |||
| 7,350 | 30.12 | 1.89 | 95.4 | 32.80 | |||
| 7,460 | 29.16 | 2.12 | 95.1 | 32.80 |
Set display mode to: Large image | Zoom image | Transcription
Images and transcriptions on this page, including medium image downloads, may be used under the Creative Commons Attribution 4.0 International Licence unless otherwise stated. ![]()
| Permanent URL | https://digital.nls.uk/75033261 |
|---|
| Description | With some observations on the influence of dietary on the physical development and well-being of the people of Bengal by D. McCay. |
|---|---|
| Shelfmark | IP/QB.10 |
| Additional NLS resources: | |
| Description | 61 volume new series covers bacteriological research work from 1902-1913 by Indian Medical Service staff. Laboratory experiments are recorded in detail. Many are accompanied by illustrations showing microscopic views and features of plant and animal matter. (Calcutta : Supt. of Govt. Print., India, 1885-1901.) |
|---|---|
| Shelfmark | IP/QB.10 |
| Description | 12 titles describe the health and sanitary conditions of the army in India. Lists British, European and Indian troops plus families of military personnel. 3 volumes of army regulations included. 73 volumes make up the Scientific Memoirs series, a journal by Indian Medical Service staff. |
|---|---|
| Description | The Institutions collection consists of 106 volumes from British India, dating from the 1860's to the 1940's. Divided into reports on medical institutions, army health, and lock hospitals. Education of indigenous medical students and maintenance of troop health shown in annual reports and statistical tables. |
|---|---|
| Description | The India Papers collection contains publications of the central (Imperial) Government and many Indian states. Most states came under British rule. Much of the collection dates from between the post-Mutiny re-organisation of the Indian Government and Indian Independence in 1947. Some items published in London by John Murray. |
|---|---|
| Shelfmark | India Papers |