Medicine - Institutions > Army health reports and medical documents > Vital statistics of India. Vol. IV, Annual returns from 1871 to 1876. British Army of India, Native Army and jails of Bengal > Women and children of European regiments, 1876
(726)
Download files
Individual page:
Thumbnail gallery: Grid view | List view

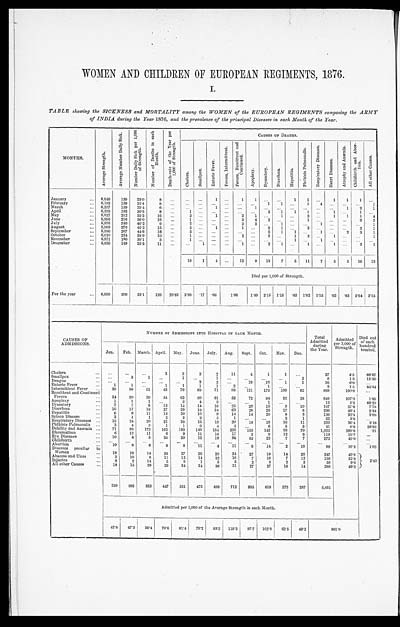
WOMEN AND CHILDREN OF EUROPEAN REGIMENTS 1876.
I.
TABLE showing the SICKNESS and MORTALITY among the WOMEN of the EUROPEAN REGIMENTS composing the ARMY
of INDIA during the Year 1876, and the prevalence of the principal Diseases in each Month of the Year.
| MONTHS. | Average Strength. | Average Number Daily Sick. | Number Daily Sick per 1,000 of Strength. |
Number of Deaths in each Month. |
Death-rate of the Year per 1,000 of Strength. |
CAUSES OF DEATHS. | ||||||||||||||
| Cholera. | Smallpox. | Enteric Fevers. | Fevers, Intermittent. | Fevers, Remittent and Continued. |
Apoplexy. | Dysentery. | Diarrhœa. | Hepatisis. | Phthisis Pulmonalis. | Respiratory Diseases. | Heart Diseases. | Atrophy and Anæmia. | Childbirth and Abor- tion. |
All other Causes. | ||||||
| January | 6,048 | 139 | 23.0 | 8 | ... | ... | ... | 1 | ... | 1 | 1 | ... | ... | 1 | 1 | ... | 1 | 1 | 1 | ... |
| February | 6,193 | 139 | 22.4 | 8 | ... | ... | ... | ... | ... | ... | ... | 1 | 1 | ... | 1 | 4 | ... | ... | ... | 1 |
| March | 6,257 | 159 | 25.4 | 6 | ... | ... | ... | 1 | ... | ... | 1 | ... | ... | ... | ... | ... | ... | 1 | 2 | 1 |
| April | 6,328 | 193 | 30.5 | 8 | ... | 1 | ... | ... | ... | ... | ... | 2 | 1 | 1 | 1 | ... | 1 | ... | 1 | ... |
| May | 6,027 | 212 | 35.2 | 16 | ... | 2 | ... | 1 | ... | 2 | 1 | ... | 1 | ... | 2 | ... | 1 | 1 | 1 | 4 |
| June | 5,996 | 216 | 36.0 | 16 | ... | 1 | ... | ... | ... | 3 | 4 | 2 | ... | ... | 1 | ... | ... | ... | 3 | 2 |
| July | 5,976 | 240 | 40.2 | 9 | ... | 2 | ... | ... | ... | 2 | 2 | ... | 1 | ... | ... | 1 | ... | ... | ... | 1 |
| August | 5,969 | 270 | 45.2 | 15 | ... | 5 | ... | 1 | ... | 1 | ... | 2 | 1 | ... | 2 | ... | ... | ... | 2 | 1 |
| September | 5,986 | 267 | 44.6 | 16 | ... | 5 | ... | ... | ... | ... | ... | 2 | 1 | 1 | ... | 1 | ... | 2 | 3 | 1 |
| October | 6,010 | 234 | 38.9 | 10 | ... | 1 | ... | ... | ... | 2 | ... | 2 | ... | 1 | 2 | ... | 1 | ... | ... | 1 |
| November | 5,971 | 180 | 30.1 | 3 | ... | 1 | ... | ... | ... | ... | ... | ... | ... | 1 | ... | 1 | ... | ... | ... | ... |
| December | 5,836 | 149 | 25.5 | 11 | ... | ... | 1 | ... | ... | 1 | ... | 2 | 1 | ... | 1 | ... | 1 | ... | 3 | 1 |
| ... | ... | ... | ... | ... | ... | 18 | 1 | 4 | ... | 12 | 9 | 13 | 7 | 5 | 11 | 7 | 5 | 5 | 16 | 13 |
| ... | ... | ... | ... | ... | ... | Died per 1,000 of Strength. | ||||||||||||||
| For the year | 6,050 | 200 | 33.1 | 126 | 20.83 | 2.98 | .17 | .66 | 1.98 | 1.49 | 2.15 | 1.15 | .83 | 1.82 | 1.15 | .83 | .83 | 2.64 | 2.15 | |
| CAUSES OF ADMISSIONS. |
NUMBER OF ADMISSIONS INTO HOSPITAL IN EACH MONTH. | Total Admitted during the Year. |
Admitted per 1,000 of Strength. |
Died out of each hundred treated. |
|||||||||||
| Jan. | Feb. | March. | April. | May. | June. | July. | Aug. | Sept. | Oct. | Nov. | Dec. | ||||
| Cholera | ... | ... | ... | 3 | 3 | 2 | 2 | 11 | 4 | 1 | 1 | ... | 27 | 4.5 | 66.67 |
| Smallpox | ... | 3 | 1 | ... | 1 | ... | 1 | ... | ... | ... | ... | 2 | 8 | 1.3 | 12.50 |
| Dengue | ... | ... | ... | ... | ... | 3 | 2 | ... | 19 | 10 | 1 | 1 | 36 | 6.0 | ... |
| Enteric Fever | 1 | 1 | ... | 1 | 1 | 1 | 1 | 2 | ... | 1 | ... | ... | 9 | 1.5 | 44.44 |
| Intermittent Fever | 39 | 56 | 51 | 43 | 76 | 68 | 71 | 98 | 121 | 175 | 109 | 62 | 969 | 160.0 | ... |
| Remittent and Continued Fevers |
24 | 20 | 30 | 54 | 63 | 89 | 61 | 52 | 72 | 94 | 52 | 38 | 649 | 107.3 | 1.85 |
| Apoplexy | 1 | 1 | 1 | ... | 2 | 4 | 3 | ... | ... | 1 | ... | ... | 13 | 2.2 | 69.23 |
| Dysentery | 7 | 7 | 8 | 13 | 14 | 14 | 16 | 25 | 29 | 15 | 9 | 10 | 167 | 27.6 | 7.78 |
| Diarrhœa | 16 | 17 | 18 | 27 | 29 | 18 | 34 | 63 | 29 | 23 | 17 | 8 | 299 | 49.4 | 2.34 |
| Hepatitis | 6 | 6 | 11 | 13 | 20 | 10 | 9 | 14 | 14 | 20 | 8 | 5 | 136 | 22.5 | 3.68 |
| Spleen Disease | 3 | 1 | 1 | 2 | 2 | 3 | 5 | 1 | ... | ... | 3 | 1 | 22 | 3.6 | ... |
| Respiratory Diseases | 15 | 24 | 20 | 21 | 28 | 15 | 13 | 20 | 18 | 19 | 16 | 11 | 220 | 36.4 | 3.18 |
| Phthisis Pulmonalis | 2 | 4 | 3 | 1 | 1 | 6 | 4 | 4 | ... | 6 | 5 | 5 | 41 | 6.8 | 26.83 |
| Debility and Anæmia | 71 | 83 | 123 | 162 | 193 | 149 | 154 | 232 | 153 | 142 | 93 | 70 | 1,625 | 268.6 | .31 |
| Rheumatism | 6 | 12 | 11 | 6 | 9 | 11 | 16 | 17 | 2 | 9 | 12 | 8 | 119 | 19.7 | ... |
| Eye Diseases | 10 | 4 | 5 | 24 | 20 | 12 | 19 | 86 | 55 | 23 | 7 | 7 | 272 | 45.0 | ... |
| Childbirth | ... | ... | ... | ... | ... | ... | ... | ... | ... | ... | ... | ... | ... | ... | ... |
| Abortion | 10 | 8 | 6 | 8 | 8 | 11 | 4 | 11 | 6 | 14 | 2 | 10 | 98 | 16.2 | 1.02 |
| Diseases peculiar to Women |
19 | 19 | 14 | 24 | 27 | 20 | 20 | 24 | 27 | 19 | 14 | 20 | 247 | 40.8 | 2.43 |
| Abscess and Ulcer | 3 | 10 | 8 | 11 | 12 | 14 | 22 | 16 | 7 | 16 | 7 | 12 | 138 | 22.8 | |
| Injuries | 8 | 2 | 14 | 5 | 8 | 1 | 5 | 5 | 2 | 3 | 2 | 3 | 58 | 9.6 | |
| All other Causes | 18 | 15 | 28 | 29 | 34 | 24 | 36 | 31 | 27 | 27 | 15 | 14 | 298 | 49.2 | |
| ... | 259 | 293 | 353 | 447 | 551 | 475 | 498 | 712 | 585 | 618 | 373 | 287 | 5,451 | ... | ... |
| ... | Admitted per 1,000 of the Average Strength in each Month. | ... | ... | ||||||||||||
| ... | 42.8 | 47.3 | 56.4 | 70.6 | 91.4 | 79.2 | 83.3 | 119.3 | 97.7 | 102.8 | 62.5 | 49.2 | 901.0 | ... | |
Set display mode to: Large image | Zoom image | Transcription
Images and transcriptions on this page, including medium image downloads, may be used under the Creative Commons Attribution 4.0 International Licence unless otherwise stated. ![]()
| Permanent URL | https://digital.nls.uk/75012220 |
|---|


