Medicine - Institutions > Army health reports and medical documents > Vital statistics of India. Vol. IV, Annual returns from 1871 to 1876. British Army of India, Native Army and jails of Bengal > Native troops, 1872
(234)
Download files
Individual page:
Thumbnail gallery: Grid view | List view

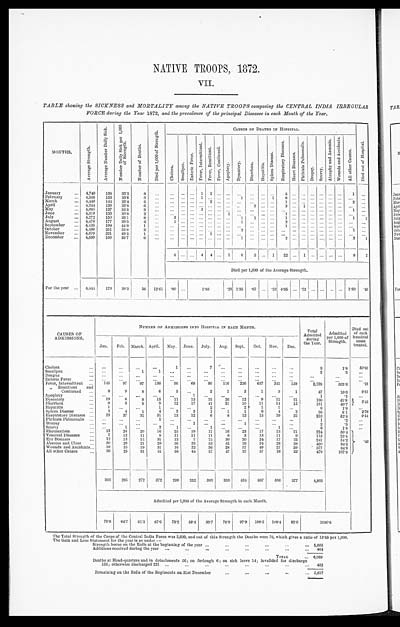
NATIVE TROOPS, 1872.
VII.
TABLE showing the SICKNESS and MORTALITY among the NATIVE TROOPS composing the CENTRAL INDIA IRREGULAR
FORCE during the Year 1872, and the prevalence of the principal Diseases in each Month of the Year.
| MONTHS. | Average Strength. | Average Number Daily Sick. | Number Daily Sick per 1,000 of Strength. |
Number of Deaths. | Died per 1,000 of Strength. | CAUSES OF DEATHS IN HOSPITAL. | Died out of Hospital. | ||||||||||||||||||
| Cholera. | Smallpox. | Enteric Fever. | Fever, Intermittent. | Fever, Remittent. | Fever, Continued. | Apoplexy. | Dysentery. | Diarrhœa. | Hepatitis. | Spleen Disease. | Respiratory Diseases. | Heart Diseases. | Phthisis Pulmonalis. | Dropsy. | Scurvy. | Atrophy and Anæmia. | Wounds and Accidents. | All other Causes. | |||||||
| January... | 4,740 | 158 | 33.3 | 8 | ... | ... | ... | ... | 1 | 1 | ... | ... | ... | ... | ... | ... | 5 | ... | ... | ... | ... | ... | ... | 1 | ... |
| February... | 4,555 | 153 | 33.6 | 9 | ... | ... | ... | ... | 1 | ... | ... | ... | 1 | ... | ... | 1 | 6 | ... | ... | ... | ... | ... | ... | ... | ... |
| March... | 4,440 | 144 | 32.4 | 5 | ... | ... | ... | ... | ... | 2 | ... | ... | ... | ... | ... | ... | 1 | ... | ... | ... | ... | ... | ... | 2 | ... |
| April... | 4,244 | 139 | 32.8 | 6 | ... | ... | ... | ... | ... | ... | ... | ... | ... | 2 | ... | ... | 3 | ... | 1 | ... | ... | ... | ... | ... | ... |
| May... | 4,085 | 137 | 33.5 | 3 | ... | ... | ... | ... | 2 | ... | ... | ... | ... | ... | ... | ... | ... | ... | ... | ... | ... | ... | ... | 1 | ... |
| June... | 4,319 | 133 | 30.8 | 2 | ... | ... | ... | ... | ... | ... | ... | 1 | ... | ... | ... | ... | 1 | ... | ... | ... | ... | ... | ... | ... | ... |
| July... | 4,272 | 150 | 35.1 | 8 | ... | 3 | ... | ... | ... | ... | ... | ... | 1 | 1 | ... | ... | 1 | ... | ... | ... | ... | ... | ... | 1 | 1 |
| August... | 4,476 | 177 | 39.5 | 4 | ... | 1 | ... | ... | ... | ... | ... | ... | 1 | ... | ... | ... | 2 | ... | ... | ... | ... | ... | ... | ... | ... |
| September... | 4,435 | 199 | 44.9 | 1 | ... | ... | ... | ... | ... | ... | ... | ... | ... | ... | ... | ... | 1 | ... | ... | ... | ... | ... | ... | ... | ... |
| October... | 4,496 | 251 | 55.8 | 3 | ... | ... | ... | ... | ... | ... | ... | ... | 2 | ... | ... | ... | ... | ... | ... | ... | ... | ... | ... | 1 | ... |
| November... | 4,670 | 231 | 49.5 | 1 | ... | ... | ... | ... | ... | 1 | ... | ... | ... | ... | ... | ... | ... | ... | ... | ... | ... | ... | ... | ... | ... |
| December... | 4,599 | 169 | 36.7 | 6 | ... | ... | ... | ... | ... | ... | ... | ... | 1 | ... | ... | ... | 2 | ... | ... | ... | ... | ... | ... | 2 | 1 |
| 4 | ... | ... | 4 | 4 | ... | 1 | 6 | 3 | ... | 1 | 22 | ... | 1 | ... | ... | ... | ... | 8 | 2 | ||||||
| Died per 1,000 of the Average Strength. | |||||||||||||||||||||||||
| For the year... | 4,444 | 170 | 38.3 | 56 | 12.61 | .90 | ... | 1.80 | .23 | 1.35 | .67 | ... | .23 | 4.95 | ... | .23 | ... | ... | ... | ... | 1.80 | .45 | |||
| CAUSES OF ADMISSIONS. |
NUMBER OF ADMISSIONS INTO HOSPITAL IN EACH MONTH. | Total Admitted during the Year. |
Admitted per 1,000 of Strength. |
Died out of each hundred cases treated. |
|||||||||||
| Jan. | Feb. | March. | April. | May. | June. | July. | Aug. | Sept. | Oct. | Nov. | Dec. | ||||
| Cholera... | ... | ... | ... | ... | 1 | ... | 7 | ... | ... | ... | ... | ... | 8 | 1.8 | 50.00 |
| Smallpox... | ... | ... | 1 | 1 | ... | ... | ... | ... | ... | ... | ... | ... | 2 | .5 | ... |
| Dengue... | ... | ... | ... | ... | ... | ... | ... | ... | ... | ... | ... | ... | ... | ... | ... |
| Enteric Fever... | ... | ... | ... | ... | ... | ... | ... | ... | ... | ... | ... | ... | ... | ... | ... |
| Fever, Intermittent... | 145 | 97 | 97 | 136 | 96 | 69 | 90 | 116 | 236 | 657 | 341 | 158 | 2,238 | 503.6 | .18 |
| " Remittent and Continued... |
8 | 9 | 8 | 6 | 5 | ... | 2 | 1 | 3 | 1 | 3 | 1 | 47 | 10.6 | 8.51 |
| Apoplexy... | ... | ... | ... | ... | ... | 1 | ... | ... | ... | ... | ... | ... | 1 | .2 | ... |
| Dysentery... | 19 | 6 | 8 | 15 | 11 | 13 | 35 | 26 | 12 | 9 | 11 | 21 | 186 | 41.9 | 2.45 |
| Diarrhœa... | 9 | 3 | 9 | 9 | 12 | 17 | 41 | 31 | 10 | 11 | 14 | 15 | 181 | 40.7 | |
| Hepatitis... | 1 | ... | ... | 1 | ... | ... | 2 | ... | 2 | 1 | 1 | ... | 8 | 1.8 | ... |
| Spleen Disease... | 2 | 4 | 1 | 4 | 3 | 3 | 1 | 1 | 1 | 9 | 4 | 3 | 36 | 8.1 | 2.78 |
| Respiratory Diseases... | 23 | 37 | 31 | 31 | 13 | 12 | 6 | 8 | 13 | 15 | 19 | 25 | 233 | 52.4 | 9.44 |
| Phthisis Pulmonalis... | ... | ... | ... | 1 | ... | ... | ... | ... | ... | ... | ... | ... | 1 | .2 | ... |
| Dropsy... | ... | ... | ... | ... | ... | 1 | ... | ... | 1 | ... | ... | ... | 2 | .5 | ... |
| Scurvy... | ... | 1 | ... | 2 | 1 | ... | 1 | ... | ... | ... | 1 | ... | 6 | 1.4 | ... |
| Rheumatism... | 13 | 24 | 20 | 16 | 25 | 19 | 17 | 16 | 23 | 17 | 13 | 21 | 224 | 50.4 | .43 |
| Venereal Diseases... | 7 | 12 | 11 | 8 | 11 | 11 | 11 | 6 | 3 | 13 | 11 | 9 | 113 | 25.4 | |
| Eye Diseases... | 12 | 13 | 15 | 31 | 13 | 7 | 24 | 30 | 30 | 24 | 17 | 25 | 241 | 54.2 | |
| Abscess and Ulcer... | 50 | 29 | 21 | 29 | 36 | 33 | 53 | 43 | 26 | 34 | 28 | 38 | 420 | 94.5 | |
| Wounds and Accidents... | 38 | 35 | 19 | 31 | 16 | 22 | 36 | 28 | 37 | 49 | 27 | 39 | 377 | 84.8 | |
| All other Causes... | 36 | 25 | 31 | 51 | 56 | 44 | 57 | 47 | 37 | 57 | 16 | 22 | 479 | 107.8 | |
| 363 | 295 | 272 | 372 | 299 | 252 | 383 | 353 | 434 | 897 | 506 | 377 | 4,803 | |||
| Admitted per 1,000 of the Average Strength in each Month. | |||||||||||||||
| 76.6 | 64.7 | 61.3 | 87.6 | 73.2 | 58.4 | 89.7 | 78.9 | 97.9 | 199.5 | 108.4 | 82.0 | 1080.8 | |||
The Total Strength of the Corps of the Central India Force was 5,609, and out of this Strength the Deaths were 76, which gives a ratio of 13.55 per 1,000.
The Gain and Loss Statement for the year is as under:—
| Strength borne on the Rolls at the beginning of the year... | 5,605 |
| Additions received during the year... | 464 |
| TOTAL... | 6,069 |
| Deaths at Head-quarters and in detachments 56; on furlough 6; on sick leave 14; invalided for discharge 155; otherwise discharged 221... |
452 |
| Remaining on the Rolls of the Regiments on 31st December... | 5,617 |
Set display mode to: Large image | Zoom image | Transcription
Images and transcriptions on this page, including medium image downloads, may be used under the Creative Commons Attribution 4.0 International Licence unless otherwise stated. ![]()
| Permanent URL | https://digital.nls.uk/75010695 |
|---|


