Medicine - Institutions > Army health reports and medical documents > Vital statistics of India. Vol. V, Reports of 1876 on armies & jails and on epidemic cholera > Section III - Statistics of the prisoners of Bengal for eighteen years, from 1859 to 1876: and epidemic fevers as affecting the jail population >
(255) Page 235
Download files
Individual page:
Thumbnail gallery: Grid view | List view

Appendix.]
AGGREGATE OF THE STATISTICS OF THE TEN-YEAR PERIOD 1867 TO 1876.
235
ADMINISTRATION OF BENGAL PROPER—TYPICAL JAILS, AND JAILS
OF SPECIAL CHARACTERISTICS.
XXIV.
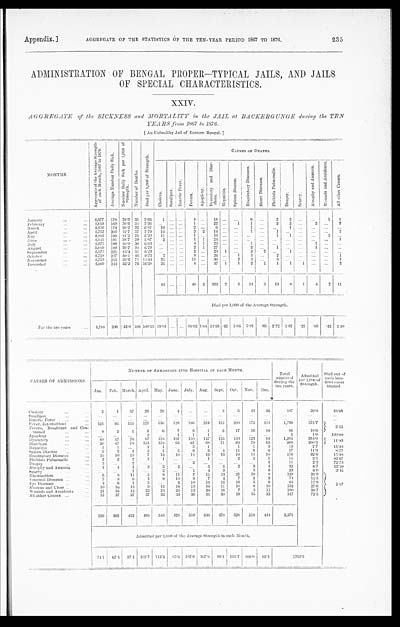
AGGREGATE of the SICKNESS and MORTALITY in the JAIL at BACKERGUNGE during the TEN
YEARS from 1867 to 1876.
[An Unhealthy Jail of Eastern Bengal.]
| MONTHS. | Aggregate of the Average Strength of each Month, 1867 to 1876. |
Average Number Daily Sick. | Number Daily Sick per 1,000 of Strength. |
Number of Deaths. | Died per 1,000 of Strength. | CAUSES OF DEATHS. | |||||||||||||||
| Cholera. | Smallpox. | Enteric Fever. | Fevers. | Apoplexy. | Dysentery and Diar- rhœa. |
Hepatitis. | Spleen Disease. | Respiratory Diseases. | Heart Diseases. | Phthisis Pulmonalis. | Dropsy. | Scurvy. | Atrophy and Anæmia. | Wounds and accidents. | All other Causes. | ||||||
| January | 4,577 | 178 | 38.9 | 35 | 7.65 | 1 | ... | ... | 4 | ... | 18 | ... | ... | 6 | ... | 2 | 2 | ... | ... | 1 | 1 |
| February | 4,619 | 169 | 36.6 | 34 | 7.36 | ... | ... | ... | 1 | ... | 22 | ... | 1 | 1 | ... | 2 | 2 | ... | 2 | ... | 3 |
| March | 4,656 | 178 | 38.2 | 32 | 6.87 | 19 | ... | ... | 2 | ... | 9 | ... | ... | 1 | ... | ... | 1 | ... | ... | ... | ... |
| April | 4,752 | 203 | 42.7 | 37 | 7.79 | 14 | ... | ... | 3 | 2 | 14 | ... | ... | 1 | ... | 1 | ... | ... | ... | ... | 2 |
| May | 4,805 | 198 | 41.2 | 25 | 5.20 | 11 | ... | ... | 1 | ... | 10 | ... | ... | ... | ... | 1 | 1 | ... | ... | 1 | ... |
| June | 4,941 | 191 | 38.7 | 29 | 5.87 | 2 | ... | ... | 1 | 1 | 24 | ... | ... | ... | ... | ... | ... | ... | ... | ... | 1 |
| July | 4,971 | 199 | 40.0 | 30 | 6.03 | ... | ... | ... | 4 | 1 | 23 | ... | ... | 1 | ... | ... | ... | ... | 1 | ... | ... |
| August | 5,009 | 199 | 39.7 | 34 | 6.79 | ... | ... | ... | 2 | 1 | 27 | ... | ... | 2 | ... | 1 | ... | ... | 1 | ... | ... |
| September | 4,973 | 221 | 44.4 | 31 | 6.23 | ... | ... | ... | 2 | ... | 23 | 1 | ... | 2 | 2 | ... | 1 | ... | ... | ... | ... |
| October | 4,728 | 237 | 50.1 | 46 | 9.73 | 2 | ... | ... | 9 | ... | 26 | ... | 1 | 5 | ... | 2 | ... | ... | ... | ... | 1 |
| November | 4,753 | 255 | 53.6 | 71 | 14.94 | 21 | ... | ... | 11 | ... | 30 | ... | 2 | 3 | ... | 3 | ... | ... | ... | ... | 1 |
| December | 4,669 | 244 | 52.3 | 76 | 16.28 | 21 | ... | ... | 8 | ... | 37 | 1 | 1 | 2 | 1 | 1 | 1 | 1 | ... | ... | 2 |
| 91 | ... | ... | 48 | 5 | 263 | 2 | 5 | 24 | 3 | 13 | 8 | 1 | 4 | 2 | 11 | ||||||
| Died per 1,000 of the Average Strength. | |||||||||||||||||||||
| For the ten years | 4,788 | 206 | 43.0 | 480 | 100.25 | 19.01 | ... | ... | 10.02 | 1.04 | 54.93 | .42 | 1.04 | 5.01 | .63 | 2.72 | 1.67 | .21 | .83 | .42 | 2.30 |
| CAUSES OF ADMISSIONS. | NUMBER OF ADMISSIONS INTO HOSPITAL IN EACH MONTH. | Total admitted during the ten years. |
Admitted per 1,000 of Strength. |
Died out of each hun- dred cases treated. |
|||||||||||
| Jan. | Feb. | March. | April. | May. | June. | July. | Aug. | Sept. | Oct. | Nov. | Dec. | ||||
| Cholera | 2 | 1 | 37 | 26 | 29 | 4 | ... | ... | 3 | 6 | 43 | 36 | 187 | 39.0 | 48.66 |
| Smallpox | ... | ... | ... | ... | ... | ... | ... | ... | ... | ... | ... | ... | ... | ... | ... |
| Enteric Fever | ... | ... | ... | ... | ... | ... | ... | ... | .... | ... | ... | ... | ... | ... | ... |
| Fever, Intermittent | 121 | 95 | 155 | 121 | 136 | 126 | 186 | 219 | 154 | 200 | 172 | 114 | 1,799 | 375.7 | 2.55 |
| Fever, Remittent and Con- tinued. |
8 | 2 | 1 | 5 | 6 | 7 | 8 | 1 | 5 | 17 | 16 | 10 | 86 | 18.0 | |
| Apoplexy | ... | ... | ... | 2 | ... | 1 | 1 | 1 | ... | ... | ... | ... | 5 | 1.0 | 100.00 |
| Dysentery | 68 | 57 | 76 | 87 | 128 | 107 | 140 | 127 | 125 | 133 | 123 | 93 | 1,264 | 264.0 | 11.83 |
| Diarrhœa | 50 | 47 | 78 | 155 | 138 | 65 | 61 | 68 | 71 | 66 | 78 | 83 | 960 | 200.5 | |
| Hepatitis | 1 | 1 | ... | 1 | 1 | ... | 3 | 1 | ... | 1 | 1 | 3 | 13 | 2.7 | 15.33 |
| Spleen Disease | 5 | 3 | 1 | 3 | 1 | 5 | 6 | 3 | 4 | 11 | 9 | 6 | 57 | 11.9 | 8.77 |
| Respiratory Diseases | 15 | 10 | 15 | 7 | 13 | 10 | 14 | 16 | 13 | 10 | 15 | 18 | 156 | 32.6 | 15.38 |
| Phthisis Pulmonalis | 2 | 2 | 2 | 1 | 1 | ... | ... | 1 | ... | 2 | 3 | 1 | 15 | 3.1 | 86.67 |
| Dropsy | 3 | ... | 2 | ... | ... | ... | 2 | ... | ... | ... | ... | 4 | 11 | 2.3 | 72.73 |
| Atrophy and Anæmia | 1 | 4 | 1 | 2 | 3 | 2 | ... | 5 | 5 | 2 | 3 | 4 | 32 | 6.7 | 12.50 |
| Seurvy | ... | ... | 1 | ... | 2 | ... | 1 | 4 | 9 | ... | 3 | 9 | 29 | 6.0 | 3.45 |
| Rheumatism | 6 | 8 | 11 | 5 | 9 | 11 | 7 | 11 | 13 | 21 | 19 | 8 | 129 | 26.9 | 1.67 |
| Venereal Diseases | 7 | 3 | 9 | 4 | 9 | 10 | 9 | 7 | 4 | 7 | 2 | 3 | 74 | 15.5 | |
| Eye Diseases | 4 | 6 | 1 | 5 | ... | 2 | 10 | 15 | 15 | 16 | 5 | 6 | 85 | 17.8 | |
| Abscess and Ulcer | 10 | 10 | 13 | 9 | 12 | 16 | 13 | 10 | 11 | 10 | 8 | 10 | 132 | 27.6 | |
| Wounds and Accidents | 21 | 16 | 12 | 23 | 24 | 24 | 13 | 20 | 16 | 7 | 3 | 11 | 190 | 39.7 | |
| All other Causes | 15 | 37 | 37 | 37 | 32 | 33 | 36 | 31 | 30 | 19 | 15 | 25 | 347 | 72.5 | |
| 339 | 302 | 452 | 493 | 544 | 423 | 510 | 540 | 478 | 528 | 518 | 444 | 5,571 | |||
| Admitted per 1,000 of the Average Strength in each Month. | |||||||||||||||
| 74.1 | 65.4 | 97.1 | 103.7 | 113.2 | 85.6 | 102.6 | 107.8 | 96.1 | 111.7 | 109.0 | 95.1 | 1163.5 | |||
Set display mode to: Large image | Zoom image | Transcription
Images and transcriptions on this page, including medium image downloads, may be used under the Creative Commons Attribution 4.0 International Licence unless otherwise stated. ![]()
| Permanent URL | https://digital.nls.uk/74994054 |
|---|
| Description | Appendix to Section III. Ten-year standard for the jail population of the Bengal Presidency, based on the statistics of the years from 1867 to 1876. Tables I-LVI |
|---|


