

Medicine - Institutions > Army health reports and medical documents > Vital statistics of India. Vol. V, Reports of 1876 on armies & jails and on epidemic cholera > Section III - Statistics of the prisoners of Bengal for eighteen years, from 1859 to 1876: and epidemic fevers as affecting the jail population >
(251) Page 231
Download files
Individual page:
Thumbnail gallery: Grid view | List view
Appendix.]
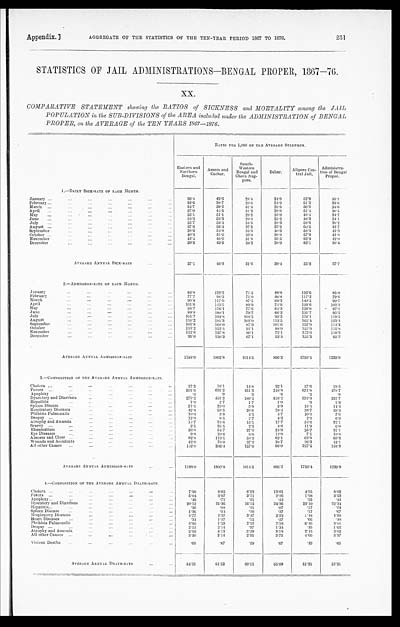
AGGREGATE OF THE STATISTICS OF THE TEN-YEAR PERIOD 1867 TO 1876.
231
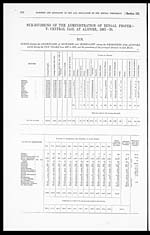
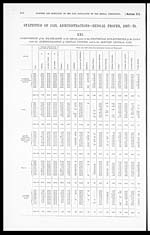
STATISTICS OF JAIL ADMINISTRATIONS—BENGAL PROPER, 1867—76.
XX.
COMPARATIVE STATEMENT showing the RATIOS of SICKNESS and MORTALITY among the JAIL
POPULATION in the SUB-DIVISIONS of the AREA included under the ADMINISTRATION of BENGAL
PROPER, on the AVERAGE of the TEN YEARS 1867—1876.
| RATIO PER 1,000 OF THE AVERAGE STRENGTH. | ||||||
| Eastern and Northern Bengal. |
Assam and Cachar. |
South- Western Bengal and Chota Nag- pore. |
Behar. | Alipore Cen- tral Jail. |
Administra- tion of Bengal Proper. |
|
| 1.—DAILY SICK-RATE OF EACH MONTH. | ||||||
| January | 36.4 | 42.6 | 28.4 | 24.9 | 52.9 | 35.1 |
| February | 33.6 | 38.7 | 29.8 | 24.9 | 51.2 | 33.6 |
| March | 34.7 | 39.3 | 31.4 | 25.8 | 50.3 | 34.6 |
| April | 37.0 | 44.5 | 31.3 | 28.8 | 51.4 | 36.5 |
| May | 35.1 | 51.1 | 29.2 | 25.9 | 48.4 | 34.7 |
| June | 34.3 | 53.3 | 28.8 | 25.2 | 48.3 | 34.1 |
| July | 35.7 | 56.4 | 34.5 | 28.3 | 58.6 | 38.2 |
| August | 37.6 | 56.4 | 37.5 | 37.2 | 60.5 | 41.7 |
| September | 38.6 | 54.8 | 34.8 | 40.3 | 58.3 | 41.9 |
| October | 40.3 | 51.0 | 33.0 | 38.8 | 57.9 | 41.8 |
| November | 42.4 | 48.0 | 31.8 | 35.5 | 62.9 | 42.0 |
| December | 39.6 | 43.9 | 28.2 | 28.9 | 62.1 | 38.4 |
| AVERAGE ANNUAL SICK-RATE | 37.1 | 48.3 | 31.6 | 30.4 | 55.3 | 37.7 |
| 2.—ADMISSION-RATE OF EACH MONTH. | ||||||
| January | 84.8 | 122.3 | 71.5 | 48.8 | 122.6 | 85.0 |
| February | 77.7 | 98.3 | 71.0 | 48.8 | 117.2 | 79.6 |
| March | 96.8 | 117.9 | 87.5 | 68.3 | 140.5 | 99.7 |
| April | 101.6 | 143.5 | 89.9 | 74.9 | 129.0 | 103.3 |
| May | 94.7 | 176.1 | 77.6 | 64.3 | 129.0 | 97.1 |
| June | 89.0 | 180.1 | 79.7 | 66.2 | 131.7 | 95.5 |
| July | 101.7 | 193.8 | 108.5 | 93.2 | 176.1 | 119.5 |
| August | 110.2 | 181.3 | 102.0 | 113.5 | 165.4 | 123.4 |
| September | 105.8 | 168.0 | 87.9 | 101.6 | 152.0 | 114.2 |
| October | 113.2 | 152.4 | 91.1 | 88.0 | 155.9 | 115.8 |
| November | 112.6 | 137.8 | 80.1 | 72.1 | 173.6 | 110.2 |
| December | 99.0 | 130.3 | 67.1 | 53.4 | 155.3 | 95.2 |
| AVERAGE ANNUAL ADMISSION-RATE. | 1188.0 | 1802.8 | 1014.5 | 896.2 | 1750.4 | 1239.9 |
| 3.—COMPOSITION OF THE AVERAGE ANNUAL ADMISSION-RATE. | ||||||
| Cholera | 17.2 | 16.1 | 14.8 | 32.1 | 17.6 | 19.5 |
| Fevers | 501.6 | 631.2 | 451.3 | 248.8 | 671.8 | 478.7 |
| Apoplexy | .6 | .9 | .3 | .8 | .3 | .6 |
| Dysentery and Diarrhæa | 273.2 | 451.2 | 189.2 | 316.2 | 575.9 | 331.7 |
| Hepatitis | 1.9 | 2.7 | 1.7 | 1.0 | .9 | 1.6 |
| Spleen Disease | 21.5 | 29.0 | 5.8 | 3.9 | 15.4 | 14.3 |
| Respiratory Diseases | 42.8 | 59.5 | 38.6 | 28.4 | 38.7 | 39.3 |
| Phthisis Pulmonalis | 10.0 | 3.8 | 4.5 | 4.7 | 10.0 | 7.6 |
| Dropsy | 12.0 | 8.5 | 2.7 | 4.3 | 2.9 | 6.9 |
| Atrophy and Anæmia | 14.7 | 25.6 | 15.1 | 17.7 | 54.6 | 22.1 |
| Scurvy | 2.1 | 35.5 | 2.3 | 4.6 | 11.9 | 6.0 |
| Rheumatism | 33.8 | 54.7 | 27.8 | 24.9 | 25.7 | 31.1 |
| Eye Diseases | 9.8 | 20.6 | 8.0 | 12.0 | 7.1 | 10.8 |
| Abscess and Ulcer | 62.8 | 119.1 | 58.2 | 62.1 | 63.8 | 69.3 |
| Wounds and Accidents | 42.0 | 78.0 | 37.2 | 38.7 | 26.3 | 42.1 |
| All other Causes | 142.0 | 266.4 | 157.0 | 96.0 | 227.5 | 158.3 |
| AVERAGE ANNUAL ADMISSION-RATE | 1188.0 | 1802.8 | 1014.5 | 896.2 | 1750.4 | 1239.9 |
| 4.—COMPOSITION OF THE AVERAGE ANNUAL DEATH-RATE. | ||||||
| Cholera | 7.50 | 8.65 | 6.23 | 13.01 | 4.95 | 8.02 |
| Fevers | 5.04 | 3.97 | 3.11 | 2.26 | 1.98 | 3.53 |
| Apoplexy | .49 | .71 | .31 | .42 | .33 | .44 |
| Dysentery and Diarrhœa | 20.12 | 21.36 | 16.15 | 34.36 | 23.10 | 22.34 |
| Hepatitis | .30 | .08 | .41 | .07 | .17 | .24 |
| Spleen Disease | 1.36 | .24 | .20 | .37 | .17 | .67 |
| Respiratory Diseases | 4.77 | 4.37 | 3.47 | 3.23 | 5.48 | 4.20 |
| Heart Diseases | .34 | 1.27 | .15 | .27 | .66 | .40 |
| Phthisis Pulmonalis | 4.90 | 1.59 | 2.32 | 2.16 | 6.40 | 3.81 |
| Dropsy | 2.52 | 2.14 | .97 | 1.34 | .49 | 1.62 |
| Atrophy and Anæmia | 2.99 | 4.13 | 3.29 | 3.18 | 2.43 | 3.02 |
| All other Causes | 3.30 | 2.14 | 2.91 | 3.75 | 4.66 | 3.37 |
| Violent Deaths | .68 | .87 | .59 | .67 | .49 | .65 |
| AVERAGE ANNUAL DEATH-RATE | 54.31 | 51.52 | 40.11 | 65.09 | 51.31 | 52.31 |
Set display mode to: Large image | Zoom image | Transcription
Images and transcriptions on this page, including medium image downloads, may be used under the Creative Commons Attribution 4.0 International Licence unless otherwise stated. ![]()
| Permanent URL | https://digital.nls.uk/74994042 |
|---|
| Description | Appendix to Section III. Ten-year standard for the jail population of the Bengal Presidency, based on the statistics of the years from 1867 to 1876. Tables I-LVI |
|---|
| Description | Part of series is called Reports bringing up the statistical history of the European Army in India and of the Native Army and jail population of Bengal to 1876; and the cholera history of 1875 and 1876. In continuation of reports embracing the period from 1817-1872. |
|---|---|
| Shelfmark | IP/QA.5 |
| Additional NLS resources: | |
| Description | 12 titles describe the health and sanitary conditions of the army in India. Lists British, European and Indian troops plus families of military personnel. 3 volumes of army regulations included. 73 volumes make up the Scientific Memoirs series, a journal by Indian Medical Service staff. |
|---|---|
| Description | The Institutions collection consists of 106 volumes from British India, dating from the 1860's to the 1940's. Divided into reports on medical institutions, army health, and lock hospitals. Education of indigenous medical students and maintenance of troop health shown in annual reports and statistical tables. |
|---|---|
| Description | The India Papers collection contains publications of the central (Imperial) Government and many Indian states. Most states came under British rule. Much of the collection dates from between the post-Mutiny re-organisation of the Indian Government and Indian Independence in 1947. Some items published in London by John Murray. |
|---|---|
| Shelfmark | India Papers |