

Medicine - Institutions > Army health reports and medical documents > Medical and sanitary reports of the native army of Madras > Medical and sanitary report of the native army of Madras for the year 1876
(92) Page 83
Download files
Individual page:
Thumbnail gallery: Grid view | List view
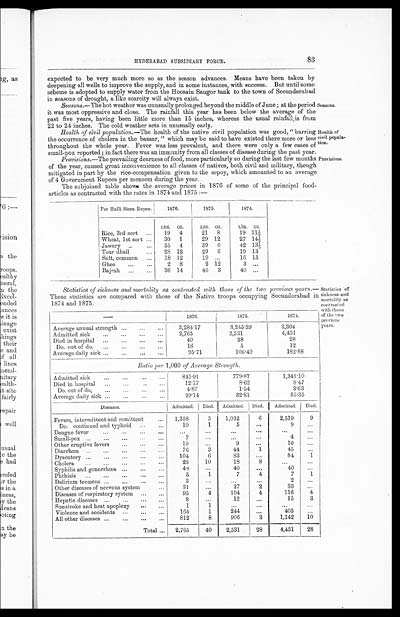
HYDERABAD SUBSIDIARY FORCE.
83
expected to be very much more so as the season advances. Means have been taken by
deepening all wells to improve the supply, and in some instances, with success. But until some
scheme is adopted to supply water from the Hoosain Saugor tank to the town of Secunderabad
in seasons of drought, a like scarcity will always exist.
Seasons.
Seasons. —The hot weather was unusually prolonged beyond the middle of June; at the period
it was most oppressive and close. The rainfall this year has been below the average of the
past five years, having been little more than 15 inches, whereas the usual rainfall is from
22 to 24 inches. The cold weather sets in unusually early.
Health of
civil popula-
tion.
Health of civil population. —The health of the native civil population was good, "barring
the occurrence of cholera in the bazaar, " which may be said to have existed there more or less
throughout the whole year. Fever was less prevalent, and there were only a few cases of
small-pox reported; in fact there was an immunity from all classes of disease during the past year.
Provisions.
Provisions. —The prevailing dearness of food, more particularly so during the last few months
of the year, caused great inconvenience to all classes of natives, both civil and military, though
mitigated in part by the rice-compensation given to the sepoy, which amounted to an average
of 4 Government Rupees per mensem during the year.
The subjoined table shows the average prices in 1876 of some of the principal food-
articles as contrasted with the rates in 1874 and 1875:—
| Per Halli Sicca Rupee. | 1876. | 1875. | 1874. | |||
| LBS. | OZ. | LBS. | OZ. | LBS. | OZ. | |
| Rice, 3rd sort | 19 | 4 | 21 | 8 | 19 | 11½ |
| Wheat, 1st sort | 30 | 1 | 29 | 12 | 27 | 14⅓ |
| Jawary | 35 | 4 | 39 | 6 | 42 | 13⅓ |
| Tour dhall | 28 | 12 | 29 | 6 | 19 | 13 |
| Salt, common | 18 | 12 | 19 | ... | 16 | 15 |
| Ghee | 2 | 8 | 2 | 12 | 3 | ... |
| Bajrah | 36 | 14 | 46 | 3 | 40 | ... |
Statistics of
sickness and
mortality as
contrasted
with those
of the two
previous
years.
Statistics of sickness and mortality as contrasted with those of the two previous years. —
These statistics are compared with those of the Native troops occupying Secunderabad in
1874 and 1875.
| — | 1876. | 1875. | 1874. | |||
| Average annual strength | 3,284.17 | 3,245.39 | 3,304 | |||
| Admitted sick | 2,765 | 2,531 | 4,431 | |||
| Died in hospital | 40 | 28 | 28 | |||
| Do. out of do. | 16 | 5 | 12 | |||
| Average daily sick | 95.71 | 106.49 | 182.88 | |||
| Ratio per 1,000 of Average Strength. | ||||||
| Admitted sick | 841.91 | 779.87 | 1,341.10 | |||
| Died in hospital | 12.17 | 8.62 | 8.47 | |||
| Do. out of do. | 4.87 | 1.54 | 3.63 | |||
| Average daily sick | 29.14 | 32.81 | 55.35 | |||
| Diseases. | Admitted. | Died. | Admitted. | Died. | Admitted. | Died. |
| Fevers, intermittent and remittent | 1,358 | 5 | 1,032 | 6 | 2,519 | 9 |
| Do. continued and typhoid | 10 | 1 | 5 | ... | 9 | ... |
| Dengue fever | ... | ... | ... | ... | ... | ... |
| Small-pox | 7 | ... | ... | ... | 4 | ... |
| Other eruptive fevers | 19 | ... | 9 | ... | 10 | ... |
| Diarrhœa | 76 | 3 | 44 | 1 | 45 | ... |
| Dysentery | 104 | 6 | 83 | ... | 84 | 1 |
| Cholera | 23 | 10 | 18 | 8 | ... | ... |
| Syphilis and gonorrhœa | 48 | ... | 40 | ... | 40 | ... |
| Phthisis | 5 | 1 | 7 | 4 | 7 | 1 |
| Delirium tremens | 3 | ... | ... | ... | 2 | ... |
| Other diseases of nervous system | 31 | ... | 27 | 2 | 33 | ... |
| Diseases of respiratory system | 95 | 4 | 104 | 4 | 116 | 4 |
| Hepatic diseases | 8 | ... | 12 | ... | 15 | 3 |
| Sunstroke and heat apoplexy | 1 | 1 | ... | ... | ... | ... |
| Violence and accidents | 165 | 1 | 244 | ... | 405 | ... |
| All other diseases | 812 | 8 | 906 | 3 | 1,142 | 10 |
| Total | 2,765 | 40 | 2,531 | 28 | 4,431 | 28 |
Set display mode to: Large image | Zoom image | Transcription
Images and transcriptions on this page, including medium image downloads, may be used under the Creative Commons Attribution 4.0 International Licence unless otherwise stated. ![]()
| Permanent URL | https://digital.nls.uk/74991580 |
|---|
| Description | Reports cover 1872, 1875-1878. Lists morbidity and mortality rates, invaliding and discharge plus hospitals. Describes huts and lines, troop movements, food, clothing and vaccination. Line inspections and general descriptions of sanitary conditions are present for each regiment in a division. Library lacks 1873, 1874. |
|---|---|
| Shelfmark | IP/25/AF.3 |
| Additional NLS resources: | |
| Description | 12 titles describe the health and sanitary conditions of the army in India. Lists British, European and Indian troops plus families of military personnel. 3 volumes of army regulations included. 73 volumes make up the Scientific Memoirs series, a journal by Indian Medical Service staff. |
|---|---|
| Description | The Institutions collection consists of 106 volumes from British India, dating from the 1860's to the 1940's. Divided into reports on medical institutions, army health, and lock hospitals. Education of indigenous medical students and maintenance of troop health shown in annual reports and statistical tables. |
|---|---|
| Description | The India Papers collection contains publications of the central (Imperial) Government and many Indian states. Most states came under British rule. Much of the collection dates from between the post-Mutiny re-organisation of the Indian Government and Indian Independence in 1947. Some items published in London by John Murray. |
|---|---|
| Shelfmark | India Papers |