

Medicine - Institutions > Reports from medical colleges, schools and research institutions > Report on the Calcutta medical institutions > Calcutta medical institutions reports 1871-78 > Report on the Calcutta Medical Institutions for the year 1877
(615) Page 30
Download files
Individual page:
Thumbnail gallery: Grid view | List view
30
REPORT ON THE
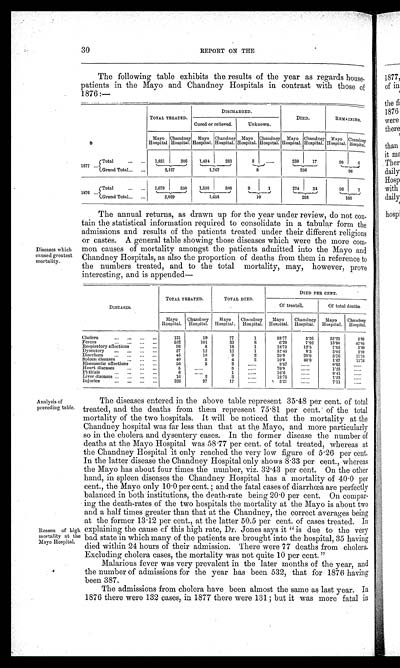
The following table exhibits the results of the year as regards house-
patients in the Mayo and Chandney Hospitals in contrast with those of
1876:—
| TOTAL TREATED. | DISCHARGED. | DIED. | REMAINING. | ||||||||
| Cured or relieved. | Unknown. | ||||||||||
| Mayo Hospital. |
Chandney Hospital. |
Mayo Hospital. |
Chandney Hospital. |
Mayo Hospital. |
Chandney Hospital. |
Mayo Hospital. |
Chandney Hospital. |
Mayo Hospital. |
Chandney Hospital. |
||
| 1877 | Total | 1,821 | 306 | 1,484 | 283 | 8 | ... | 239 | 17 | 90 | 6 |
| Grand Total | 2,127 | 1,767 | 8 | 256 | 96 | ||||||
| 1876 | Total | 1,679 | 350 | 1,350 | 308 | 9 | 1 | 224 | 34 | 96 | 7 |
| Grand Total | 2,029 | 1,658 | 10 | 258 | 103 | ||||||
Diseases which
caused greatest
mortality.
The annual returns, as drawn up for the year under review, do not con-
tain the statistical information required to consolidate in a tabular form the
admissions and results of the patients treated under their different religions
or castes. A general table showing those diseases which were the more com-
mon causes of mortality amongst the patients admitted into the Mayo and
Chandney Hospitals, as also the proportion of deaths from them in reference to
the numbers treated, and to the total mortality, may, however, prove
interesting, and is appended—
| DISEASES. | TOTAL TREATED. | TOTAL DIED. | DIED PER CENT. | |||||
| Of treated. | Of total deaths. | |||||||
| Mayo Hospital. |
Chandney Hospital. |
Mayo Hospital. |
Chandney Hospital. |
Mayo Hospital. |
Chandney Hospital. |
Mayo Hospital. |
Chandney Hospital. |
|
| Cholera | 131 | 19 | 77 | 1 | 58.77 | 5.26 | 32.21 | 5.89 |
| Fevers | 532 | 101 | 33 | 8 | 6.20 | 7.92 | 13.80 | 47.05 |
| Respiratory affections | 96 | 8 | 18 | 1 | 18.75 | 12.5 | 7.53 | 5.89 |
| Dysentery | 37 | 12 | 12 | 1 | 32.43 | 8.3 | 5.02 | 5.89 |
| Diarrhœa | 45 | 10 | 9 | 2 | 20.0 | 20.0 | 3.76 | 11.76 |
| Spleen diseases | 40 | 5 | 4 | 2 | 10.0 | 40.0 | 1.67 | 11.76 |
| Rheumatic affections | 56 | 3 | 2 | ... | 3.57 | ... | 0.83 | ... |
| Heart diseases | 5 | ... | 3 | ... | 70.0 | ... | 1.25 | ... |
| Phthisis | 6 | ... | 1 | ... | 16.6 | ... | 0.41 | ... |
| Liver diseases | 16 | 2 | 3 | ... | 18.75 | ... | 1.25 | ... |
| Injuries | 326 | 97 | 17 | ... | 5.21 | ... | 7.11 | ... |
Analysis of
preceding table.
Reason of high
mortality at the
Mayo Hospital.
The diseases entered in the above table represent 35.48 per cent. of total
treated, and the deaths from them represent 75.81 per cent. of the total
mortality of the two hospitals. It will be noticed that the mortality at the
Chandney hospital was far less than that at the Mayo, and more particularly
so in the cholera and dysentery cases. In the former disease the number of
deaths at the Mayo Hospital was 58.77 per cent. of total treated, whereas at
the Chandney Hospital it only reached the very low figure of 5.26 per cent.
In the latter disease the Chandney Hospital only shows 8.33 per cent., whereas
the Mayo has about four times the number, viz. 32.43 per cent. On the other
hand, in spleen diseases the Chandney Hospital has a mortality of 40.0 per
cent., the Mayo only 10.0 per cent.; and the fatal cases of diarrhœa are perfectly
balanced in both institutions, the death-rate being 20.0 per cent. On compar-
ing the death-rates of the two hospitals the mortality at the Mayo is about two
and a half times greater than that at the Chandney, the correct averages being
at the former 13.12 per cent., at the latter 50.5 per cent. of cases treated. In
explaining the cause of this high rate, Dr. Jones says it "is due to the very
bad state in which many of the patients are brought into the hospital, 35 having
died within 24 hours of their admission. There were 77 deaths from cholera.
Excluding cholera cases, the mortality was not quite 10 per cent."
Malarious fever was very prevalent in the later months of the year, and
the number of admissions for the year has been 532, that for 1876 having
been 387.
The admissions from cholera have been almost the same as last year. In
1876 there were 132 cases, in 1877 there were 131; but it was more fatal in
Set display mode to: Large image | Zoom image | Transcription
Images and transcriptions on this page, including medium image downloads, may be used under the Creative Commons Attribution 4.0 International Licence unless otherwise stated. ![]()
| Permanent URL | https://digital.nls.uk/74974766 |
|---|
| Description | Reports cover 1871-1900. Describes work of Calcutta Medical College Hospital, police and civil hospitals. Dispensaries and lunatic asylums also documented. Extensive tables show surgical operations, patient admissions and mortality rates. Includes finances, staffing and buildings. |
|---|---|
| Shelfmark | IP/6/HG.4 |
| Additional NLS resources: | |
| Description | 13 titles. Describes research work and conditions, treatments, vaccine production, medical education, public health and disease outbreaks. Extensive tables show mortality rates and patient admissions. These - some from asylums, jails, dispensaries, civil and police hospitals – will be useful to epidemiologists. |
|---|
| Description | The Institutions collection consists of 106 volumes from British India, dating from the 1860's to the 1940's. Divided into reports on medical institutions, army health, and lock hospitals. Education of indigenous medical students and maintenance of troop health shown in annual reports and statistical tables. |
|---|---|
| Description | The India Papers collection contains publications of the central (Imperial) Government and many Indian states. Most states came under British rule. Much of the collection dates from between the post-Mutiny re-organisation of the Indian Government and Indian Independence in 1947. Some items published in London by John Murray. |
|---|---|
| Shelfmark | India Papers |