

Medicine - Institutions > Reports from medical colleges, schools and research institutions > Report on the Calcutta medical institutions > Calcutta medical institutions reports 1871-78 > Report on the Calcutta Medical Institutions for the year 1871
(57) [Page 47]
Download files
Individual page:
Thumbnail gallery: Grid view | List view
![(53) [Page 47] -](https://deriv.nls.uk/dcn17/7497/74972775.17.jpg)
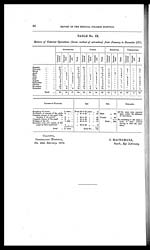
ANNUAL REPORT OF THE PRESIDENCY GENERAL HOSPITAL,
CALCUTTA,
DURING THE YEAR 1871.
Average Daily Sick
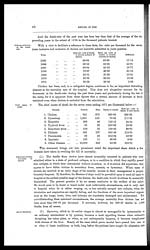
THE average daily sick during the seven years ending 1871 has been as follows:—
| Years. | Average daily sick. |
| 1865 | 159.02 |
| 1866 | 153.60 |
| 1867 | 145.35 |
| 1868 | 168.72 |
| 1869 | 171.05 |
| 1870 | 167.16 |
| 1871 | 161.25 |
Average number of
sick treated.
Statistics of Sickness and Mortality.
The aggregate sickness and mortality during the past as compared with the six
preceding years, are displayed in the columns of the sub-joined statement.
| Years. | Treated. | Died. | Ratio per 1,000 of deaths to treated. |
| 1865 | 2,431 | 170 | 69.93 |
| 1866 | 2,416 | 238 | 98.50 |
| 1867 | 2,377 | 152 | 63.94 |
| 1868 | 2,449 | 177 | 72.27 |
| 1869 | 2,641 | 140 | 53.01 |
| 1870 | 2,551 | 135 | 52.93 |
| 1865 to 1870 | 14,865 | 1,012 | 68.07 |
| 1871 | 2,546 | 93 | 36.52 |
Thus it will be observed that whilst there has throughout the seven years been a
tolerably uniform number of cases admitted for treatment, there has been manifested an
evident tendency of late years to a marked diminution of the death-rate. During the first
four years the ratio of deaths to cases treated amounted to 69.93, 98.50, 63.94, 72.27;
whereas during the remaining three years it has only reached 53.01, 52.92, 36.52.
Diminution of
death-rate.
The average ratio of deaths to treated during the six years 1865 to 1870 was 68.07,
which exceeds the ratio of the year under report to the extent of 31.55 per thousand of
treated.
Even after eliminating cholera from the account, this satisfactory state of affairs has to a
demonstratable extent been maintained, as will appear after an examination of the sub-joined
statement illustrating the aggregate sickness and mortality exclusive of cholera.
Death-rates exclud-
ing cholera
| Years. | Treated. | Died. | Ratio per 1,000 of deaths to treated. |
| 1865 | 2,329 | 123 | 52.81 |
| 1866 | 2,239 | 120 | 53.59 |
| 1867 | 2,299 | 104 | 45.23 |
| 1868 | 2,329 | 112 | 48.09 |
| 1869 | 2,580 | 96 | 37.20 |
| 1870 | 2,475 | 98 | 39.59 |
| 1865 to 1870 | 14,251 | 653 | 45.80 |
| 1871 | 2,519 | 77 | 30.56 |
Thus, after excluding cholera the ratio of mortality stands for the first four years at
52.81, 53.59, 45.23, and 48.09, whilst for the remaining three years it stands at 37.20,
39.59, and 30.56.
Set display mode to: Large image | Zoom image | Transcription
Images and transcriptions on this page, including medium image downloads, may be used under the Creative Commons Attribution 4.0 International Licence unless otherwise stated. ![]()
| Permanent URL | https://digital.nls.uk/74972773 |
|---|
| Description | Reports cover 1871-1900. Describes work of Calcutta Medical College Hospital, police and civil hospitals. Dispensaries and lunatic asylums also documented. Extensive tables show surgical operations, patient admissions and mortality rates. Includes finances, staffing and buildings. |
|---|---|
| Shelfmark | IP/6/HG.4 |
| Additional NLS resources: | |
| Description | 13 titles. Describes research work and conditions, treatments, vaccine production, medical education, public health and disease outbreaks. Extensive tables show mortality rates and patient admissions. These - some from asylums, jails, dispensaries, civil and police hospitals – will be useful to epidemiologists. |
|---|
| Description | The Institutions collection consists of 106 volumes from British India, dating from the 1860's to the 1940's. Divided into reports on medical institutions, army health, and lock hospitals. Education of indigenous medical students and maintenance of troop health shown in annual reports and statistical tables. |
|---|---|
| Description | The India Papers collection contains publications of the central (Imperial) Government and many Indian states. Most states came under British rule. Much of the collection dates from between the post-Mutiny re-organisation of the Indian Government and Indian Independence in 1947. Some items published in London by John Murray. |
|---|---|
| Shelfmark | India Papers |