Medicine - Institutions > Reports from medical colleges, schools and research institutions > Report of the King Institute of Preventive Medicine, Guindy > Report on the working of the King Institute of Preventive Medicine Guindy for the year 1924-25 (with appendices)
(201) Page 28
Download files
Individual page:
Thumbnail gallery: Grid view | List view

28
REPORT ON THE WORKING OF THE KING INSTITUTE, GUINDY
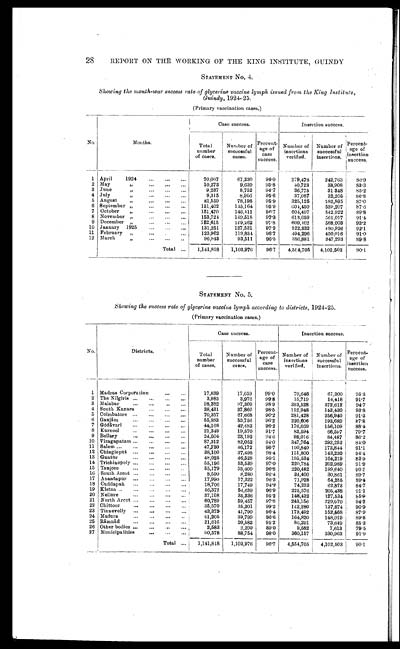
STATEMENT No. 4.
Showing the month-war success rate of glycerine vaccine lymph issued from the King Institute,
Guindy, 1924-25.
(Primary vaccination cases.)
| No. | Months. | Case success. | Insertion success. | ||||
| Total number of cases. |
Number of successful cases. |
Percent. age of case success. |
Number of insertions verified. |
Number of successful insertions. |
Percent- age of insertions success. |
||
| 1 | April 1924 | 70,067 | 67,230 | 96.0 | 279,478 | 242,763 | 86.9 |
| 2 | May " | 10,273 | 9,639 | 93.8 | 40,723 | 33,908 | 83.3 |
| 3 | June " | 9,237 | 8,752 | 94.7 | 36,775 | 31 348 | 85.2 |
| 4 | July " | 9,315 | 8,906 | 95.6 | 37,087 | 32,205 | 86.8 |
| 5 | August " | 81,559 | 78,198 | 95.9 | 325,125 | 282,895 | 87.0 |
| 6 | September " | 151,402 | 145,164 | 95.9 | 604,450 | 529,207 | 87.6 |
| 7 | October " | 151,470 | 146,411 | 96.7 | 604,497 | 542,922 | 89.8 |
| 8 | November " | 153,724 | 149,518 | 97.3 | 613,659 | 561,017 | 91.4 |
| 9 | December " | 152,615 | 149,262 | 97.8 | 609,102 | 568,003 | 93.2 |
| 10 | January 1925 | 131,251 | 127,531 | 97.2 | 522,332 | 480,926 | 92.1 |
| 11 | February " | 123,962 | 119,851 | 96.7 | 494,296 | 450,016 | 91.0 |
| 12 | March " | 96,943 | 93,511 | 96.5 | 386,881 | 347,293 | 89.8 |
| Total | 1,141,818 | 1,103,976 | 96.7 | 4,554,705 | 4,102,503 | 90.1 | |
STATEMENT No. 5.
Showing the success rate of glycerine vaccine lymph according to districts, 1924-25.
(Primary vaccination cases.)
| No. | Districts. | Case success. | Insertion success. | ||||
| Total number of cases. |
Number of successful cases. |
Percent- age of case success. |
Number of insertions verified. |
Number of successful insertions. |
Percent- age of insertion success. |
||
| 1 | Madras Corporation | 17,839 | 17,659 | 99.0 | 70,646 | 67,300 | 95.3 |
| 2 | The Nilgiris | 3,983 | 3,976 | 99.8 | 15,719 | 14,418 | 91.7 |
| 3 | Malabar | 98,382 | 97,309 | 98.9 | 393,528 | 372,612 | 94.7 |
| 4 | South Kanara | 38,431 | 37,866 | 98.5 | 152,948 | 143,430 | 93.8 |
| 5 | Coimbatore | 70,357 | 67,668 | 96.2 | 281,428 | 256,940 | 91.3 |
| 6 | Ganjām | 55,883 | 53,756 | 96.2 | 220,606 | 193,689 | 87.8 |
| 7 | Gōdāvari | 44,168 | 42,483 | 96.2 | 176,669 | 156,109 | 88.4 |
| 8 | Kurnool | 21,349 | 19,570 | 91.7 | 83,594 | 66,597 | 79.7 |
| 9 | Bellary | 24,504 | 23,192 | 94.6 | 98,016 | 84,487 | 86.2 |
| 10 | Vizagapatam | 87,312 | 82,052 | 94.0 | 347,764 | 292.252 | 84.0 |
| 11 | Salem | 47,730 | 46,172 | 96.7 | 190,840 | 173,844 | 91.1 |
| 12 | Chingleput | 38,100 | 37,498 | 98.4 | 151,800 | 143,230 | 94.4 |
| 13 | Guntūr | 48,925 | 46,528 | 95.1 | 195,534 | 164,219 | 83.9 |
| 14 | Trichinopoly | 55,196 | 53,539 | 97.0 | 220,784 | 202,989 | 94.9 |
| 15 | Tanjore | 55,179 | 53,400 | 96.8 | 220,482 | 199,640 | 90.5 |
| 10 | South Arcot | 8,590 | 8,280 | 96.4 | 34,400 | 30,861 | 89.7 |
| 17 | Anantapur | 17,990 | 17,322 | 96.3 | 71,928 | 64,285 | 89.4 |
| 18 | Cuddapah | 18,706 | 17,749 | 91.9 | 74,233 | 62,873 | 84.7 |
| 19 | Kistna | 56,372 | 54,639 | 96.9 | 225,576 | 205,438 | 91.1 |
| 20 | Nellore | 37,108 | 35,336 | 95.2 | 148,432 | 127,534 | 85.9 |
| 21 | North Arcot | 60,789 | 59,457 | 97.8 | 243,156 | 229,070 | 94.2 |
| 22 | Chittoor | 35,570 | 35,301 | 99.2 | 142,280 | 137,874. | 96.9 |
| 23 | Tinnevelly | 43,373 | 41,790 | 96.4 | 173,492 | 152,568 | 87.9 |
| 24 | Madura | 41,205 | 39,799 | 96.6 | 164,820 | 148,019 | 89.8 |
| 25 | Rāmnād | 21,616 | 20,582 | 95.2 | 86,291 | 73,649 | 85.3 |
| 26 | Other bodies | 2,583 | 2,299 | 89.0 | 9,582 | 7,613 | 79.5 |
| 27 | Municipalities | 90,578 | 88,754 | 98.0 | 360,157 | 330,963 | 91.9 |
| Total | 1,141,818 | 1,103,976 | 96.7 | 4,554,705 | 4,102,503 | 90.1 | |
Set display mode to: Large image | Zoom image | Transcription
Images and transcriptions on this page, including medium image downloads, may be used under the Creative Commons Attribution 4.0 International Licence unless otherwise stated. ![]()
| Permanent URL | https://digital.nls.uk/74936919 |
|---|
| Description | 13 titles. Describes research work and conditions, treatments, vaccine production, medical education, public health and disease outbreaks. Extensive tables show mortality rates and patient admissions. These - some from asylums, jails, dispensaries, civil and police hospitals – will be useful to epidemiologists. |
|---|


