

Medicine - Disease > Bombay plague: being a history of the progress of plague in the Bombay presidency from September 1896 to June 1899
(34) Chart

Download files
Individual page:
Thumbnail gallery: Grid view | List view
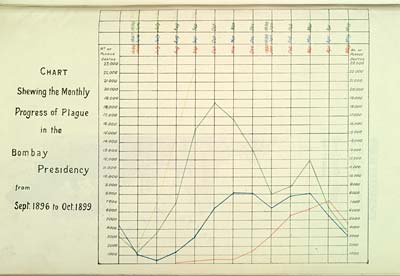
CHART
Shewing the Monthly
Progress of Plague
in the
Bombay
Presidency
from
Sept. 1896 to Oct.1899.
Shewing the Monthly
Progress of Plague
in the
Bombay
Presidency
from
Sept. 1896 to Oct.1899.
Set display mode to: Large image | Zoom image | Transcription
Images and transcriptions on this page, including medium image downloads, may be used under the Creative Commons Attribution 4.0 International Licence unless otherwise stated. ![]()
| India Papers > Medicine - Disease > Bombay plague: being a history of the progress of plague in the Bombay presidency from September 1896 to June 1899 > (34) Chart |
|---|
| Permanent URL | https://digital.nls.uk/74586036 |
|---|---|
| Description | Chart shewing the monthly progress of plague in the Bombay Presidency from Sept. 1896 to Oct. 1899. |
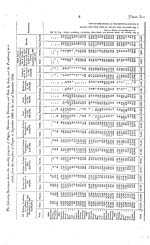
| Description | Report includes medical aspects of the plague, Plague Research Laboratory and Plague Commissions. Also contains weekly plague cases and deaths and charts for districts. |
|---|---|
| Shelfmark | IP/13/PC.6 |
| Additional NLS resources: | |
| Description | The Disease collection consists of 51 volumes from British India, dating from 1868 to 1920. Official publications varying from short reports to multi-volume histories related to disease, public health and medical research. Focuses on cholera, leprosy, plague and malaria. |
|---|---|
| Description | The India Papers collection contains publications of the central (Imperial) Government and many Indian states. Most states came under British rule. Much of the collection dates from between the post-Mutiny re-organisation of the Indian Government and Indian Independence in 1947. Some items published in London by John Murray. |
|---|---|
| Shelfmark | India Papers |