

Medicine - Disease > Report on the bubonic plague in Bombay, 1896-1897 > Volume 1
(261) Page 247
Download files
Individual page:
Thumbnail gallery: Grid view | List view
247
Appendix No. 3.
PLAN No. 2.
(Compiled by C. C. James, Esq., A.M.I.C.E., Municipal Engineer, from the
commencement of the Epidemic.)
Explanation of
Plan.
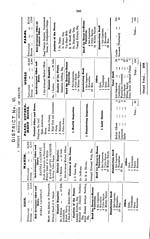
Plan No. 2 is the Progress Map of the City, showing the course of the disease from
September 1896, in which month it was first officially recognised, to the end of June 1897.
Primary colours.
The primary colours have been made use of in this plan in their regular order, as
shown by the large coloured circles in the margin, mouth by month, and this has been con-
tinued after the 7th month by using the colours again and hachuring the circles.
Census Districts.
In the margin are also shown all the Census Districts of the City.
Districts.
Each District, as it became epidemic, was coloured with the colour distinguishing
the month in which the disease arrived at the epidemic stage, and under each marginal
District heading is shown the number of cases taking place monthly in that District after the
disease had become epidemic.
Epidemic.
In deciding on the epidemic state of a District, great care was taken to carefully watch
the distribution of the cases throughout the District, and this was done in many instances by
plotting on a plan the actual cases house by house. It has often occurred in this City that
plague has raged in an epidemic form in small and confined areas, especially those inhabited by
Kolis (fishermen), while beyond such areas it has only been in a sporadic form. In such cases
the whole District was not considered epidemic.
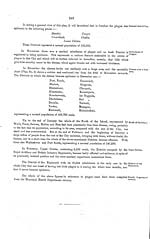
Previous to and after the epidemic period, cases appertaining to the month in which
they occurred are shown by coloured circles placed in the District, according to the monthly
colour ; the number of cases shown in the circle indicates the number occurring in that month.
Re-infection.
On the re-infection of a District, a square is substituted for a circle ; thus it will be
seen that the District of Mandvi, one of the first infected, had 31 cases, as shown by the red
coloured circle in September, In October it became, similarly with Dongri, Oomerkhadi
and Chakla, epidemic, and the whole District has been coloured orange. A reference to the
margin will show that 199 cases occurred in that month ; in November it was not epidemic,
and the number of cases (52) are shown by a yellow circle. Mandvi never became epidemic
again, and a reference to the circles will show that December gave 55 cases, January 23,
February 10. In March there was a very distinct recrudescence equally divided all over the
District (but not amounting to a fresh epidemic)-this is shown by a coloured square ; April
shows a still more pronounced recrudescence but in a limited area, and 70 cases are shown in
the coloured and hachured square representing this month. May shows a great decline, having
only 12 cases against it, and June, 3 cases.
Recrudescence in
Mandvi.
The reason of this recrudescence is probably to be found in the fact that in the
month of February the plague had so declined in Mandvi, that the inhabitants who fled from
it in October and November came back in large numbers from the mofussil, many of them
bringing plague with them ; and people living in other parts of the city more affected showed
a strong inclination to go to Mandvi in the belief that there would be no further plague
in that District.
Second Epidemic
in Dongri.
For a second epidemic the number of cases for the month is shown in red in the
margin under the District heading. (Vide the District of Dongri.) In September there were 20
cases in this District, as evidenced by the red circle. In October it became epidemic, as before
slated, and continued during November and December as shown in the margin ; but in January,
as seen by the circle coloured blue, only 13 cases are reported. In February a well-defined
recrudescence occurred all over the District, amounting to an epidemic, and the cases (65) are
shown under the marginal District heading in red figures ; this recrudescence continued during
March and April, and is recorded in the same way ; but in May the cases dropped down to 10,
and they are expressed by a coloured hachured circle in the District ; in June the number
was 11.
62
Appendix No. 3.
PLAN No. 2.
(Compiled by C. C. James, Esq., A.M.I.C.E., Municipal Engineer, from the
commencement of the Epidemic.)
Explanation of
Plan.
Plan No. 2 is the Progress Map of the City, showing the course of the disease from
September 1896, in which month it was first officially recognised, to the end of June 1897.
Primary colours.
The primary colours have been made use of in this plan in their regular order, as
shown by the large coloured circles in the margin, mouth by month, and this has been con-
tinued after the 7th month by using the colours again and hachuring the circles.
Census Districts.
In the margin are also shown all the Census Districts of the City.
Districts.
Each District, as it became epidemic, was coloured with the colour distinguishing
the month in which the disease arrived at the epidemic stage, and under each marginal
District heading is shown the number of cases taking place monthly in that District after the
disease had become epidemic.
Epidemic.
In deciding on the epidemic state of a District, great care was taken to carefully watch
the distribution of the cases throughout the District, and this was done in many instances by
plotting on a plan the actual cases house by house. It has often occurred in this City that
plague has raged in an epidemic form in small and confined areas, especially those inhabited by
Kolis (fishermen), while beyond such areas it has only been in a sporadic form. In such cases
the whole District was not considered epidemic.
Previous to and after the epidemic period, cases appertaining to the month in which
they occurred are shown by coloured circles placed in the District, according to the monthly
colour ; the number of cases shown in the circle indicates the number occurring in that month.
Re-infection.
On the re-infection of a District, a square is substituted for a circle ; thus it will be
seen that the District of Mandvi, one of the first infected, had 31 cases, as shown by the red
coloured circle in September, In October it became, similarly with Dongri, Oomerkhadi
and Chakla, epidemic, and the whole District has been coloured orange. A reference to the
margin will show that 199 cases occurred in that month ; in November it was not epidemic,
and the number of cases (52) are shown by a yellow circle. Mandvi never became epidemic
again, and a reference to the circles will show that December gave 55 cases, January 23,
February 10. In March there was a very distinct recrudescence equally divided all over the
District (but not amounting to a fresh epidemic)-this is shown by a coloured square ; April
shows a still more pronounced recrudescence but in a limited area, and 70 cases are shown in
the coloured and hachured square representing this month. May shows a great decline, having
only 12 cases against it, and June, 3 cases.
Recrudescence in
Mandvi.
The reason of this recrudescence is probably to be found in the fact that in the
month of February the plague had so declined in Mandvi, that the inhabitants who fled from
it in October and November came back in large numbers from the mofussil, many of them
bringing plague with them ; and people living in other parts of the city more affected showed
a strong inclination to go to Mandvi in the belief that there would be no further plague
in that District.
Second Epidemic
in Dongri.
For a second epidemic the number of cases for the month is shown in red in the
margin under the District heading. (Vide the District of Dongri.) In September there were 20
cases in this District, as evidenced by the red circle. In October it became epidemic, as before
slated, and continued during November and December as shown in the margin ; but in January,
as seen by the circle coloured blue, only 13 cases are reported. In February a well-defined
recrudescence occurred all over the District, amounting to an epidemic, and the cases (65) are
shown under the marginal District heading in red figures ; this recrudescence continued during
March and April, and is recorded in the same way ; but in May the cases dropped down to 10,
and they are expressed by a coloured hachured circle in the District ; in June the number
was 11.
62
Set display mode to: Large image | Zoom image | Transcription
Images and transcriptions on this page, including medium image downloads, may be used under the Creative Commons Attribution 4.0 International Licence unless otherwise stated. ![]()
| India Papers > Medicine - Disease > Report on the bubonic plague in Bombay, 1896-1897 > Volume 1 > (261) Page 247 |
|---|
| Permanent URL | https://digital.nls.uk/74580190 |
|---|---|
| Description | Appendix No. 3. |
| Description | 3 volumes consist of the largest repository of clinical descriptions of plague after the discovery of the bacillus. Twenty-seven hospitals in and around Bombay City submitted reports. Includes medical aspects of plague, house-to-house sanitation measures and foreign missions. Describes actions taken by Municipal Commissioner to control spread of plague. |
|---|---|
| Shelfmark | IP/32/PC.3 |
| Additional NLS resources: | |
| Description | The Disease collection consists of 51 volumes from British India, dating from 1868 to 1920. Official publications varying from short reports to multi-volume histories related to disease, public health and medical research. Focuses on cholera, leprosy, plague and malaria. |
|---|---|
| Description | The India Papers collection contains publications of the central (Imperial) Government and many Indian states. Most states came under British rule. Much of the collection dates from between the post-Mutiny re-organisation of the Indian Government and Indian Independence in 1947. Some items published in London by John Murray. |
|---|---|
| Shelfmark | India Papers |