

Medicine - Disease > Report on the bubonic plague in Bombay, 1896-1897 > Volume 1
(124) Page 111
Download files
Individual page:
Thumbnail gallery: Grid view | List view
111
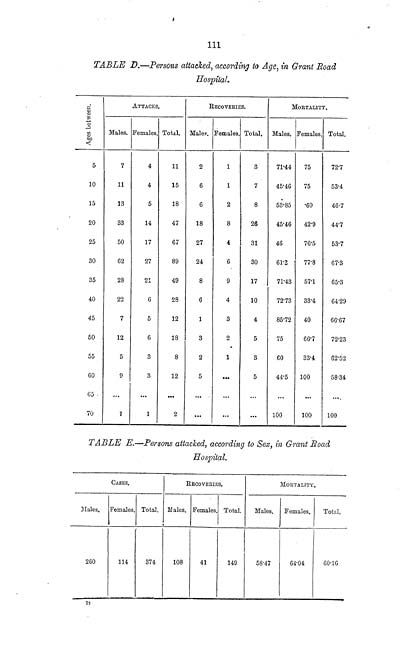
TABLE D.-Persons attacked, according to Age, in Grant Road
Hospital.
Ages between.
ATTACKS.
RECOVERIES.
MORTALITY.
Males
Females
Total
Males
Females
Total
Males
Females
Total
5
7
4
11
2
1
3
71.44
75
72.7
10
11
4
15
6
1
7
45.46
75
53.4
15
13
5
18
6
2
8
53.85
60
46.7
20
33
14
47
18
8
26
45.46
42.9
44.7
25
50
17
67
27
4
31
46
76.5
53.7
30
62
27
89
24
6
30
61.3
77.8
67.3
35
28
21
49
8
9
17
71.43
57.1
65.3
40
22
6
28
6
4
10
72.73
33.4
64.29
45
7
5
12
1
3
4
85.72
40
66.67
50
12
6
18
3
2
5
75
66.7
72.23
55
5
3
8
2
1
3
60
33.4
62.52
60
9
3
12
5
...
5
44.5
100
58.34
65
...
...
...
...
...
...
...
...
....
70
1
1
2
...
...
...
100
100
100
TABLE E.-Persons attacked, according to Sex, in Grant Road
Hospital.
CASES.
RECOVERIES
MORTALITY
Males.
Females.
Total.
Males.
Females.
Total.
Males.
Females.
Total.
260
114
374
108
41
149
58.47
64-01
60.16
Set display mode to: Large image | Zoom image | Transcription
Images and transcriptions on this page, including medium image downloads, may be used under the Creative Commons Attribution 4.0 International Licence unless otherwise stated. ![]()
| India Papers > Medicine - Disease > Report on the bubonic plague in Bombay, 1896-1897 > Volume 1 > (124) Page 111 |
|---|
| Permanent URL | https://digital.nls.uk/74579916 |
|---|
| Description | 3 volumes consist of the largest repository of clinical descriptions of plague after the discovery of the bacillus. Twenty-seven hospitals in and around Bombay City submitted reports. Includes medical aspects of plague, house-to-house sanitation measures and foreign missions. Describes actions taken by Municipal Commissioner to control spread of plague. |
|---|---|
| Shelfmark | IP/32/PC.3 |
| Additional NLS resources: | |
| Description | The Disease collection consists of 51 volumes from British India, dating from 1868 to 1920. Official publications varying from short reports to multi-volume histories related to disease, public health and medical research. Focuses on cholera, leprosy, plague and malaria. |
|---|---|
| Description | The India Papers collection contains publications of the central (Imperial) Government and many Indian states. Most states came under British rule. Much of the collection dates from between the post-Mutiny re-organisation of the Indian Government and Indian Independence in 1947. Some items published in London by John Murray. |
|---|---|
| Shelfmark | India Papers |