

Medicine - Disease > Report on enteric fever
(61) Page 45 - Chapter IV. Stations
Download files
Individual page:
Thumbnail gallery: Grid view | List view
45
CHAPTER IV.
STATIONS.
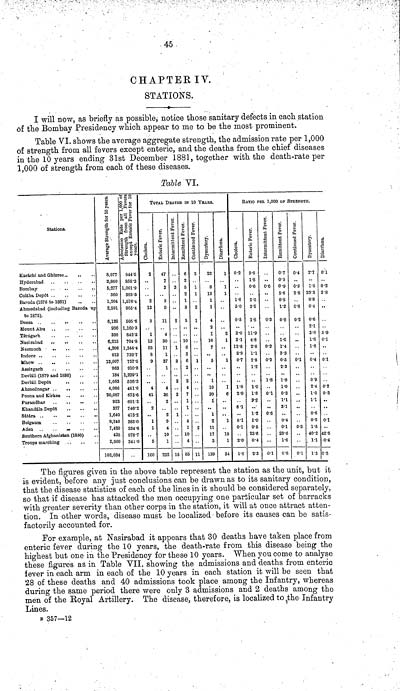
I will now, as briefly as possible, notice those sanitary defects in each station
of the Bombay Presidency which appear to me to be the most prominent.
Table VI. shows the average aggregate strength, the admission rate per 1,000
of strength from all fevers except enteric, and the deaths from the chief diseases
in the 10 years ending 31st December 1881, together with the death-rate per
1,000 of strength from each of these diseases.
Table VI.
Stations.
Average Strength for 10 years.
Admission Rate per 1,000 of Strength, from all Fevers except Enteric Fever for 10 years.
TOTAL DEATHS IN 10 YEARS.
RATIO PER 1,000 OF STRENGTH.
Cholera.
Enteric Fever.
Intermittent Fever.
Remittent Fever.
Continued Fever.
Dysentery.
Diarrha.
Cholera.
Enteric Fever.
Intermittent Fever.
Remittent Fever.
Continued Fever.
Dysentery.
Diarrha.
Karchi and Ghzree
8,077
944.5
2
47
6
3
22
1
0.2
5.8
0.7
0.4
2.7
0.1
Hyderabad
3,860
858.3
7
2
1.8
0.5
Bombay
5,277
1,001.9
3
3
5
1
8
1
0.6
0.6
0.9
0.2
1.5
0.2
Colba Dept
360
383.3
2
1
12
1
5.6
2.8
33.8
2.8
Baroda (1876 to 1881)
1,204
1,576.4
2
3
1
1
1.6
2.5
0.8
0.8
Ahmedabad (including Baroda up to 1875).
2,591
905.4
13
9
3
2
1
5.0
3.5
1.2
0.8
0.4
Deesa
6,138
595.6
3
11
2
5
1
4
0.5
1.8
0.3
0.8
0.2
0.6
Mount Abu
936
1,160.3
2
2.1
Trgarh
336
842.3
1
4
1
2
3.0
11.9
3.0
5.9
Nasirabad
6,213
704.8
13
30
10
10
1
2.1
4.8
1.6
1.6
0.1
Neemuch
4,306
1,344.4
55
11
1
6
7
12.8
2.6
0.2
1.4
1.6
Indore
913
732.7
8
1
3
8.9
1.1
3.3
Mhow
13,007
757.5
9
37
3
6
1
5
1
0.7
2.8
0.2
0.5
0.1
0.4
0.1
Assirgarh
863
910.8
1
2
1.2
2.3
Devlli (1879 and 1880)
184
1,239.1
Devlli Dept
1,083
526.3
2
2
1
1.8
1.8
0.9
Ahmednagar
4,066
481.6
4
4
4
10
1
1.0
1.0
1.0
2.4
0.2
Poona and Kirkee
20,087
675.6
41
36
3
7
20
6
2.0
1.8
0.1
0.3
1.0
0.3
Purandhar
923
691.2
2
1
1
2.2
1.1
1.1
Khandla Dept
327
746.2
2
1
6.1
3.1
Stra
1,640
473.2
2
1
1
1.2
0.6
0.6
Belgaum
9,240
383.0
1
9
4
2
1
0.1
1.0
0.4
0.2
0.1
Aden
7,420
334.6
1
4
1
2
11
0.1
0.5
0.1
0.3
1.5
Southern Afghanistan (1880)
423
978.7
10
10
17
18
23.6
23.6
40.2
42.5
Troops marching
2,560
341.0
5
1
4
3
1
2.0
0.4
1.6
1.1
0.4
102,034
160
232
15
85
11
139
34
1.6
2.3
0.1
0.8
0.1
1.3
0.3
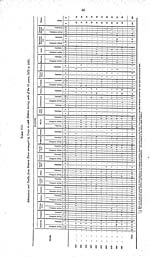
The figures given in the above table represent the station as the unit, but it
is evident, before any just conclusions can be drawn as to its sanitary condition,
that the disease statistics of each of the lines in it should be considered separately,
so that if disease has attacked the men occupying one particular set of barracks
with greater severity than other corps in the station, it will at once attract attention. In other words, disease must be localized before its causes can be satisfactorily accounted for.
For example, at Nasirabad it appears that 30 deaths have taken place from
enteric fever during the 10 years, the death-rate from this disease being the
highest but one in the Presidency for these 10 years. When you come to analyse
these figures as in Table VII. showing the admissions and deaths from enteric
fever in each arm in each of the 10 years in each station it will be seen that
28 of these deaths and 40 admissions took place among the Infantry, whereas
during the same period there were only 3 admissions and 2 deaths among the
men of the Royal Artillery. The disease, therefore, is localized to the Infantry
Lines.
B 357-12
CHAPTER IV.
STATIONS.
I will now, as briefly as possible, notice those sanitary defects in each station
of the Bombay Presidency which appear to me to be the most prominent.
Table VI. shows the average aggregate strength, the admission rate per 1,000
of strength from all fevers except enteric, and the deaths from the chief diseases
in the 10 years ending 31st December 1881, together with the death-rate per
1,000 of strength from each of these diseases.
Table VI.
Stations.
Average Strength for 10 years.
Admission Rate per 1,000 of Strength, from all Fevers except Enteric Fever for 10 years.
TOTAL DEATHS IN 10 YEARS.
RATIO PER 1,000 OF STRENGTH.
Cholera.
Enteric Fever.
Intermittent Fever.
Remittent Fever.
Continued Fever.
Dysentery.
Diarrha.
Cholera.
Enteric Fever.
Intermittent Fever.
Remittent Fever.
Continued Fever.
Dysentery.
Diarrha.
Karchi and Ghzree
8,077
944.5
2
47
6
3
22
1
0.2
5.8
0.7
0.4
2.7
0.1
Hyderabad
3,860
858.3
7
2
1.8
0.5
Bombay
5,277
1,001.9
3
3
5
1
8
1
0.6
0.6
0.9
0.2
1.5
0.2
Colba Dept
360
383.3
2
1
12
1
5.6
2.8
33.8
2.8
Baroda (1876 to 1881)
1,204
1,576.4
2
3
1
1
1.6
2.5
0.8
0.8
Ahmedabad (including Baroda up to 1875).
2,591
905.4
13
9
3
2
1
5.0
3.5
1.2
0.8
0.4
Deesa
6,138
595.6
3
11
2
5
1
4
0.5
1.8
0.3
0.8
0.2
0.6
Mount Abu
936
1,160.3
2
2.1
Trgarh
336
842.3
1
4
1
2
3.0
11.9
3.0
5.9
Nasirabad
6,213
704.8
13
30
10
10
1
2.1
4.8
1.6
1.6
0.1
Neemuch
4,306
1,344.4
55
11
1
6
7
12.8
2.6
0.2
1.4
1.6
Indore
913
732.7
8
1
3
8.9
1.1
3.3
Mhow
13,007
757.5
9
37
3
6
1
5
1
0.7
2.8
0.2
0.5
0.1
0.4
0.1
Assirgarh
863
910.8
1
2
1.2
2.3
Devlli (1879 and 1880)
184
1,239.1
Devlli Dept
1,083
526.3
2
2
1
1.8
1.8
0.9
Ahmednagar
4,066
481.6
4
4
4
10
1
1.0
1.0
1.0
2.4
0.2
Poona and Kirkee
20,087
675.6
41
36
3
7
20
6
2.0
1.8
0.1
0.3
1.0
0.3
Purandhar
923
691.2
2
1
1
2.2
1.1
1.1
Khandla Dept
327
746.2
2
1
6.1
3.1
Stra
1,640
473.2
2
1
1
1.2
0.6
0.6
Belgaum
9,240
383.0
1
9
4
2
1
0.1
1.0
0.4
0.2
0.1
Aden
7,420
334.6
1
4
1
2
11
0.1
0.5
0.1
0.3
1.5
Southern Afghanistan (1880)
423
978.7
10
10
17
18
23.6
23.6
40.2
42.5
Troops marching
2,560
341.0
5
1
4
3
1
2.0
0.4
1.6
1.1
0.4
102,034
160
232
15
85
11
139
34
1.6
2.3
0.1
0.8
0.1
1.3
0.3
The figures given in the above table represent the station as the unit, but it
is evident, before any just conclusions can be drawn as to its sanitary condition,
that the disease statistics of each of the lines in it should be considered separately,
so that if disease has attacked the men occupying one particular set of barracks
with greater severity than other corps in the station, it will at once attract attention. In other words, disease must be localized before its causes can be satisfactorily accounted for.
For example, at Nasirabad it appears that 30 deaths have taken place from
enteric fever during the 10 years, the death-rate from this disease being the
highest but one in the Presidency for these 10 years. When you come to analyse
these figures as in Table VII. showing the admissions and deaths from enteric
fever in each arm in each of the 10 years in each station it will be seen that
28 of these deaths and 40 admissions took place among the Infantry, whereas
during the same period there were only 3 admissions and 2 deaths among the
men of the Royal Artillery. The disease, therefore, is localized to the Infantry
Lines.
B 357-12
Set display mode to: Large image | Zoom image | Transcription
Images and transcriptions on this page, including medium image downloads, may be used under the Creative Commons Attribution 4.0 International Licence unless otherwise stated. ![]()
| India Papers > Medicine - Disease > Report on enteric fever > (61) Page 45 - Chapter IV. Stations |
|---|
| Permanent URL | https://digital.nls.uk/74577696 |
|---|---|
| Description | Chapter IV. Stations. |
| Description | Dated 1883, report of typhoid fever at stations occupied by British troops in Bombay Presidency. |
|---|---|
| Shelfmark | IP/13/SB.6 |
| Additional NLS resources: | |
| Description | The Disease collection consists of 51 volumes from British India, dating from 1868 to 1920. Official publications varying from short reports to multi-volume histories related to disease, public health and medical research. Focuses on cholera, leprosy, plague and malaria. |
|---|---|
| Description | The India Papers collection contains publications of the central (Imperial) Government and many Indian states. Most states came under British rule. Much of the collection dates from between the post-Mutiny re-organisation of the Indian Government and Indian Independence in 1947. Some items published in London by John Murray. |
|---|---|
| Shelfmark | India Papers |